
Markets

Source: SeekingAlpha.com
Economic Calendar
8:15 ADP Jobs Report
8:30 Goods and Services Trade
9:45 PMI Composite Final
10:00 ISM Service Index
https://www.investing.com/economic-calendar/
***New: PTG Trading Room Chat Log’s Link

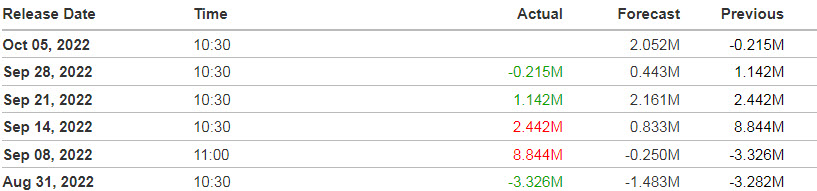
10:30 EIA Petroleum Inventories
U.S. crude inventories fell by 1.8 millon barrels for the week ended Sept. 30. That compared with a build of 4.2 million barrels reported by the API in the previous week. Economists were expecting an increase of about 1.9 million barrels.
Oil prices have made a strong start to the week on optimism that OPEC+ may decide to cut output by as much as 2 million barrels to support prices.
The API data also showed that gasoline inventories decreased by 3.5 million barrels last week, and distillate stocks fell by 4.1 million barrels.
The official government inventory report due Wednesday is expected to show weekly U.S. crude supplies rose by 2.1 million barrels last week.
S&P 500

***Written Tuesday evening for Wednesday’s trading for contribution to MrTopStep’s “The Opening Print” publication.
Prior Session was Cycle Day 2 (CD2): Markets continued to expand this cycle’s rally exceeding target objectives. Prior range was 122 handles on 2.306M contracts exchanged.
…Transition from Cycle Day 2 to Cycle Day 3
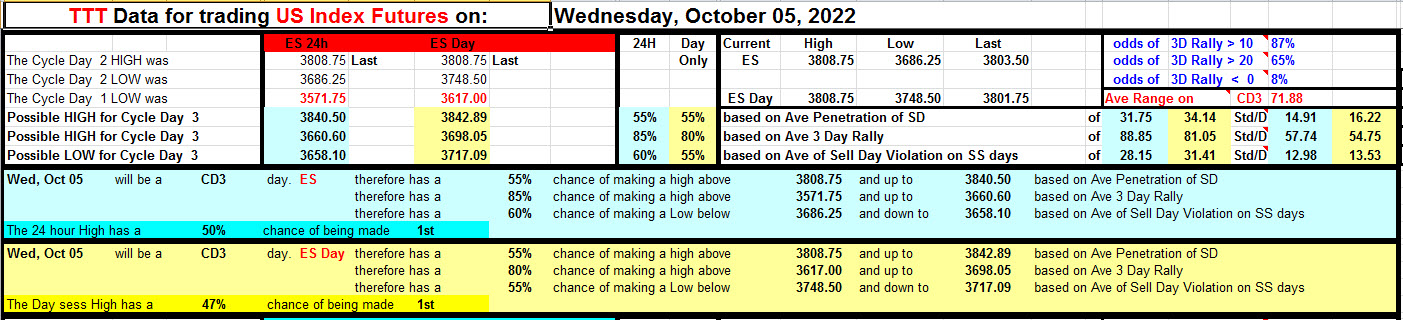
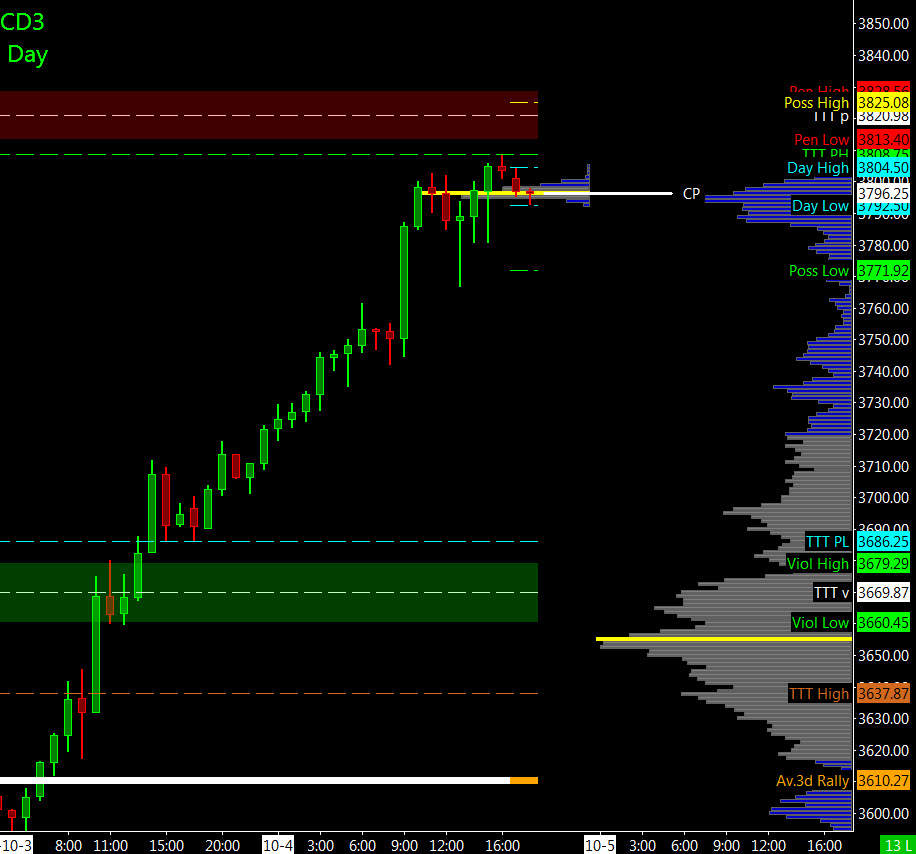
This leads us into Cycle Day 3 (CD3): Price is well above all cycle targets, so the next decline can start anytime. That said, additional upside extension levels target 3821 – 3831 zone. Failure to clear and convert prior high (3808.75) may be the catalyst for the decline/pullback. As such, estimated scenarios to consider for today’s trading.
Bull Scenario: Price sustains a bid above 3808, initially targets 3821 – 3831 zone.
Bear Scenario: Price sustains an offer below 3808, initially targets 3770 – 3765 zone.
PVA High Edge = 3805 PVA Low Edge = 3778 Prior POC = 3794
*****The 3 Day Cycle has a 91% probability of fulfilling Positive Cycle Statistics covering 12 years of recorded tracking history.
For more detailed information for both bullish and bearish projected targets, please visit: PTG 3 Day Cycle and/or reference the Cycle Spreadsheet below:
Link to access full Cycle Spreadsheet > > Cycle Day 3 (CD3)
Range Projections and Key Levels (ES) December 2022 (Z) Contract
HOD ATR Range Projection: 3874; LOD ATR Range Projection: 3693; 3 Day Central Pivot: 3685; 3 Day Cycle Target: 3660; 10 Day Average True Range 111; VIX: 29
Nasdaq 100 (NQ)

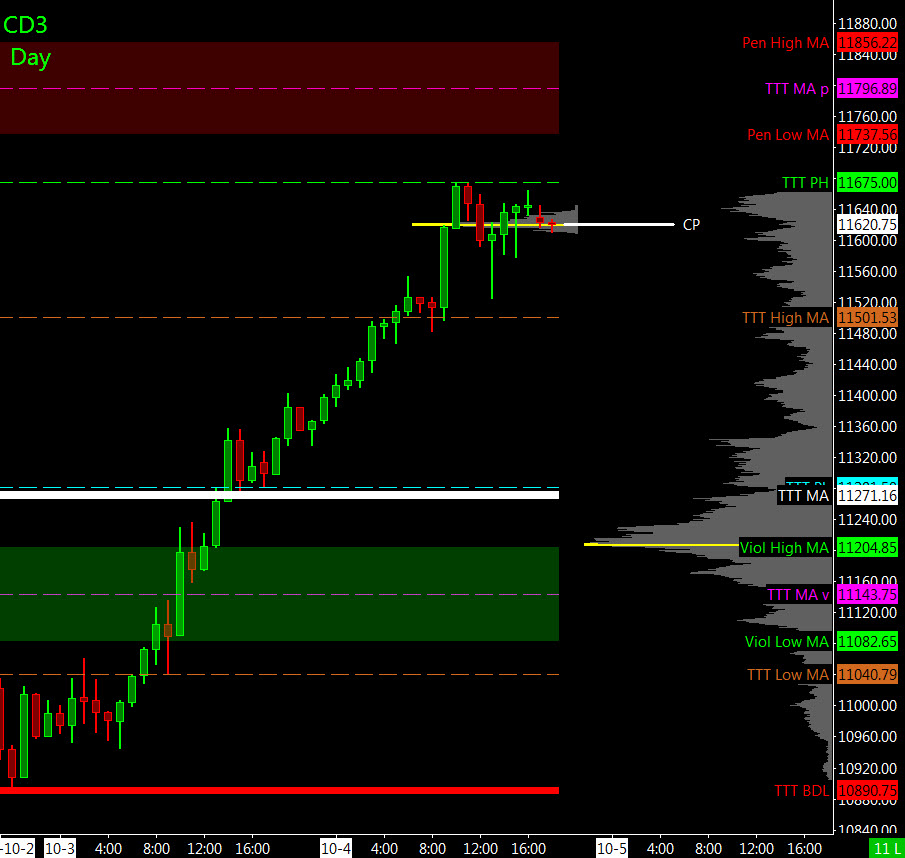
Today is Cycle Day 3 (CD3)…Three-Day Cycle Statistic was exceeded during prior session. Price is well above cycle objectives, so the next decline can begin at any time. Failure to clear and convert prior high (11675) may be the catalyst for a decline/pullback. As such, there are two estimated scenarios to consider for today’s trading.
Bull Scenario: IF Bulls sustains bid above 11675, THEN initial upside estimate targets 11738– 11797 zone.
Bear Scenario: IF Bears sustains offer below 11675, THEN initial downside estimate targets 11525 – 11501 zone.
PVA High Edge = 11667 PVA Low Edge = 11627 Prior POC = 11639
Range Projections and Key Levels (NQ) December 2022 (Z) Contract
HOD ATR Range Projection: 11900; LOD ATR Range Projection: 11254; 3 Day Central Pivot: 11289; 3 Day Cycle Target: 11271; 10 Day Average True Range: 390; VIX: 29
Trade Strategy: Our tactical trade strategy will simply remain unaltered…We’ll be flexible to trade both long and short side from Decision Pivot Levels. Continue to focus on Bull/Bear Stackers and Premium/Discounts. As always, remaining in alignment with dominant intra-day force increases probabilities of producing winning trades.
Stay Focused…Non-Biased…Disciplined ALWAYS USE STOPS!
Good Trading…David
“Knowing is not enough, We must APPLY. Willing is not enough, We must DO.” –Bruce Lee
*****This trade strategy report is disseminated for “education only” and should not be viewed in any way as a recommendation to buy or sell futures products.”
PAST PERFORMANCE IS NOT NECESSARILY INDICATIVE OF FUTURE RESULTS
IMPORTANT NOTICE! No representation is being made that the use of this strategy or any system or trading methodology will generate profits. Past performance is not necessarily indicative of future results. There is substantial risk of loss associated with trading securities and options on equities. Only risk capital should be used to trade. Trading securities is not suitable for everyone.
Disclaimer: Futures, Options, and Currency trading all have large potential rewards, but they also have large potential risk. You must be aware of the risks and be willing to accept them in order to invest in these markets. Don’t trade with money you can’t afford to lose.
This website is neither a solicitation nor an offer to Buy/Sell futures, options, or currencies. No representation is being made that any account will or is likely to achieve profits or losses similar to those discussed on this web site. The past performance of any trading system or methodology is not necessarily indicative of future results.
CFTC RULE 4.41 –HYPOTHETICAL OR SIMULATED PERFORMANCE RESULTS HAVE CERTAIN LIMITATIONS. UNLIKE AN ACTUAL PERFORMANCE RECORD, SIMULATED RESULTS DO NOT REPRESENT ACTUAL TRADING. ALSO, SINCE THE TRADES HAVE NOT BEEN EXECUTED, THE RESULTS MAY HAVE UNDER-OR-OVER COMPENSATED FOR THE IMPACT, IF ANY, OF CERTAIN MARKET FACTORS, SUCH AS LACK OF LIQUIDITY. SIMULATED TRADING PROGRAMS IN GENERAL ARE ALSO SUBJECT TO THE FACT THAT THEY ARE DESIGNED WITH THE BENEFIT OF HINDSIGHT. NO REPRESENTATION IS BEING MADE THAT ANY ACCOUNT WILL OR IS LIKELY TO ACHIEVE PROFIT OR LOSSES SIMILAR TO THOSE SHOWN