
Markets
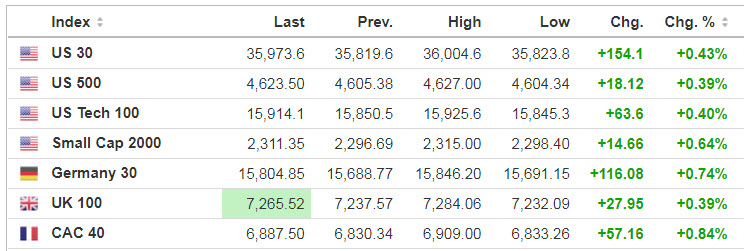
Source: SeekingAlpha.com
Economic Calendar
9:45 PMI Manufacturing Index
10:00 ISM Manufacturing Index
10:00 Construction Spending
https://www.investing.com/economic-calendar/
***New: PTG Trading Room Chat Log’s Link
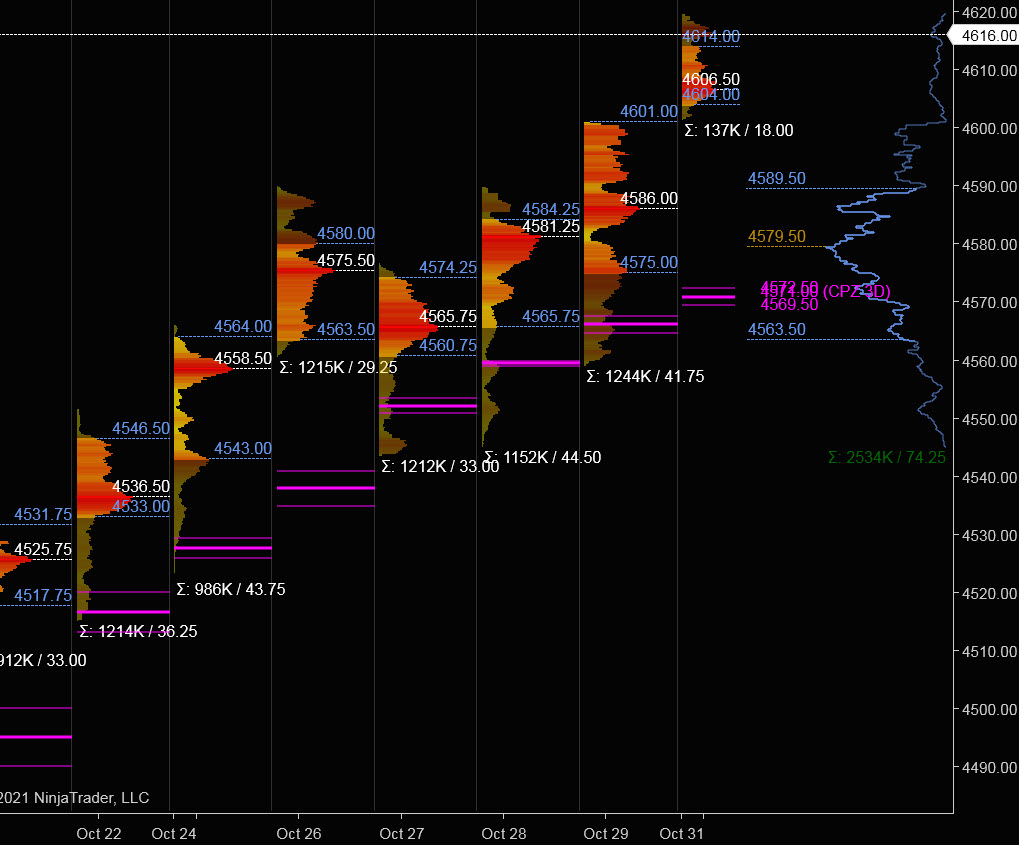
S&P 500

Prior Session was Cycle Day 2 (CD2): This index continued its upward trek to new all-time highs capping a strong prior trading week. Range was 42 handles on 1.244M contracts exchanged.
…Transition from Cycle Day 2 to Cycle Day 3
This leads us into Cycle Day 3 (CD3): Buyers remained active during overnight activity above prior high (4603.50) fulfilling CD3 Penetration Level (4614) during overnight activity. Momentum is in the bullish camp, so it is theirs to lose. Until there is a shift, our plan remains unaltered…Stay in alignment with the dominant force on pullbacks to key Decision Point Zones (DPZ). As such, estimated scenarios to consider for today’s trading.
1.) Price sustains a bid above 4603, initially targets 4614 – 4621 zone.
2.) Price sustains an offer below 4603, initially targets 4590 – 4588 zone.
*****3 Day Cycle has a 91% probability of fulfilling Positive Cycle Statistics covering 12 years of recorded tracking history.
PVA High Edge = 4601 PVA Low Edge = 4575 Prior POC = 4586
Range Projections and Key Levels (ES) December 2021 (Z) Contract
HOD ATR Range Projection: 4636; LOD ATR Range Projection: 4585; 3 Day Central Pivot: 4571; 3 Day Cycle Target: 4600; 10 Day Average True Range 34; VIX: 16.70
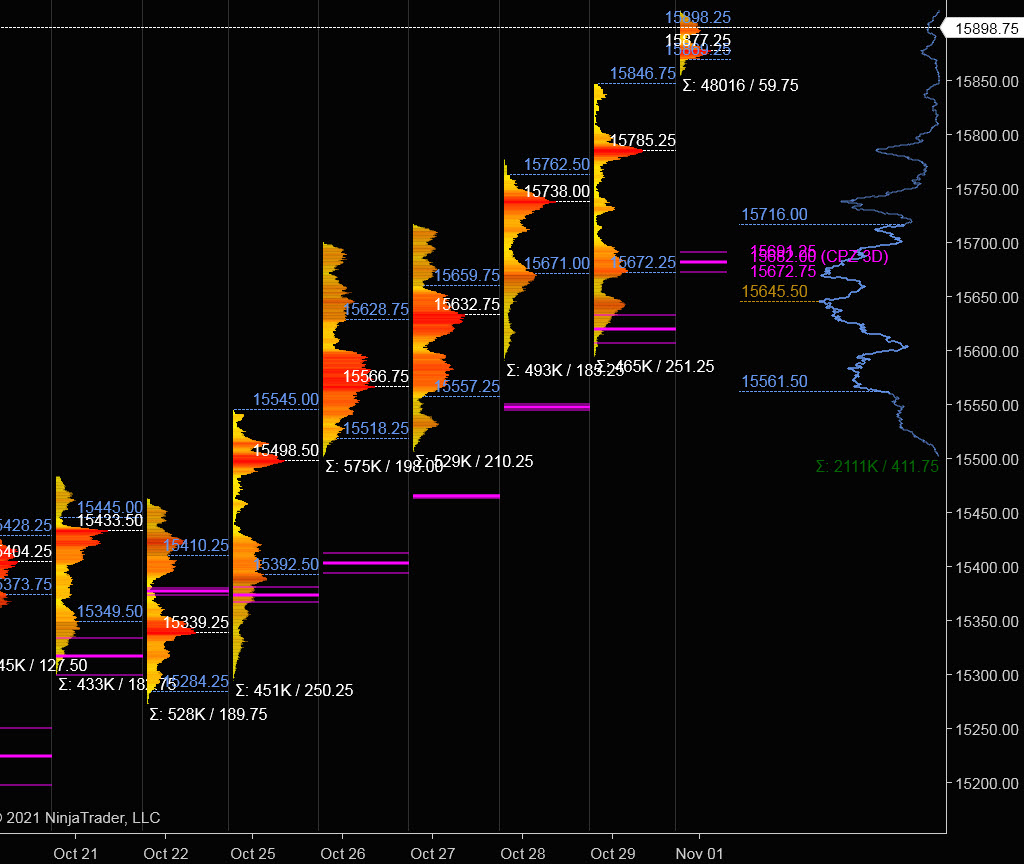
Nasdaq 100 (NQ)

Today is Cycle Day 3 (CD3)…Price is trading above prior range during overnight activity as cycle objective has been fulfilled (15820). Prior range was 251 handles on 465k contracts exchanged. As such, there are two estimated scenarios to consider for today’s trading.
PVA High Edge = 15846 PVA Low Edge = 15672 Prior POC = 15785
Bull Scenario: IF Bulls sustain a bid above 15865, THEN initial upside estimate targets 15898 – 15922 zone.
Bear Scenario: IF Bears sustain an offer below 15865, THEN initial downside estimate targets 15835 – 15820 zone.
Range Projections and Key Levels (NQ) December 2021 (Z) Contract
HOD ATR Range Projection: 16040; LOD ATR Range Projection: 15730; 3 Day Central Pivot: 13682; 3 Day Cycle Target: 15820; 10 Day Average True Range: 184; VIX: 16.70
Trade Strategy: Our tactical trade strategy will simply remain unaltered…We’ll be flexible to trade both long and short side from Decision Pivot Levels. Continue to focus on Bull/Bear Stackers and Premium/Discounts. As always, remaining in alignment with dominant intra-day force increases probabilities of producing winning trades.
Stay Focused…Non-Biased…Disciplined ALWAYS USE STOPS!
Good Trading…David
“Knowing is not enough, We must APPLY. Willing is not enough, We must DO.” –Bruce Lee
*****This trade strategy report is disseminated for “education only” and should not be viewed in any way as a recommendation to buy or sell futures products.”
PAST PERFORMANCE IS NOT NECESSARILY INDICATIVE OF FUTURE RESULTS
IMPORTANT NOTICE! No representation is being made that the use of this strategy or any system or trading methodology will generate profits. Past performance is not necessarily indicative of future results. There is substantial risk of loss associated with trading securities and options on equities. Only risk capital should be used to trade. Trading securities is not suitable for everyone.
Disclaimer: Futures, Options, and Currency trading all have large potential rewards, but they also have large potential risk. You must be aware of the risks and be willing to accept them in order to invest in these markets. Don’t trade with money you can’t afford to lose.
This website is neither a solicitation nor an offer to Buy/Sell futures, options, or currencies. No representation is being made that any account will or is likely to achieve profits or losses similar to those discussed on this web site. The past performance of any trading system or methodology is not necessarily indicative of future results.
CFTC RULE 4.41 –HYPOTHETICAL OR SIMULATED PERFORMANCE RESULTS HAVE CERTAIN LIMITATIONS. UNLIKE AN ACTUAL PERFORMANCE RECORD, SIMULATED RESULTS DO NOT REPRESENT ACTUAL TRADING. ALSO, SINCE THE TRADES HAVE NOT BEEN EXECUTED, THE RESULTS MAY HAVE UNDER-OR-OVER COMPENSATED FOR THE IMPACT, IF ANY, OF CERTAIN MARKET FACTORS, SUCH AS LACK OF LIQUIDITY. SIMULATED TRADING PROGRAMS IN GENERAL ARE ALSO SUBJECT TO THE FACT THAT THEY ARE DESIGNED WITH THE BENEFIT OF HINDSIGHT. NO REPRESENTATION IS BEING MADE THAT ANY ACCOUNT WILL OR IS LIKELY TO ACHIEVE PROFIT OR LOSSES SIMILAR TO THOSE SHOWN