
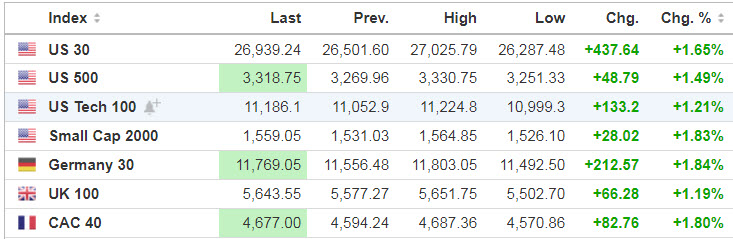
Markets

The major averages are coming off their worst monthly performance since March amid surging coronavirus infections, extinguished stimulus talks and a slump for Big Tech following quarterly earnings reports. The Dow closed out October with a 4.6% loss, the S&P 500 and the Nasdaq fell 2.8% and 2.3%, respectively, while volatility last week saw the VIX “fear gauge” spike to a four-month high.
Traders seem a little more cheerful this morning as U.S. stock index futures climbed 1.5% to start the month, as the selloff leading up to Election Day may give the market less downside risk to a contested result.
Source: SeekingAlpha.com
Economic Calendar
9:45 PMI Manufacturing Index
10:00 ISM Manufacturing Index
10:00 Construction Spending

While recent pressure on equity markets could be easing, oil prices slid on lingering worries that international lockdowns will sap energy demand. Off by nearly 6% overnight, crude futures have pared some losses, down 2.7% to $34.82/bbl. Libya and Iraq are also boosting their production, causing a rise in overall supply from OPEC+, despite having reduced quotas across its other members. While the group meets again on Nov. 10 and Dec. 1 to discuss policy, there doesn’t appear to be a great deal of leeway for further reductions.
https://www.investing.com/economic-calendar/
***New: PTG Trading Room Chat Log’s Link
S&P 500

Friday’s Session was Cycle Day 2 (CD2): Price gyrated widely in search of balance and by end of session found value between 3230 – 3260 zone. Range was 71.25 handles on 2.300M contracts exchanged.
…Transition from Cycle Day 2 to Cycle Day 3
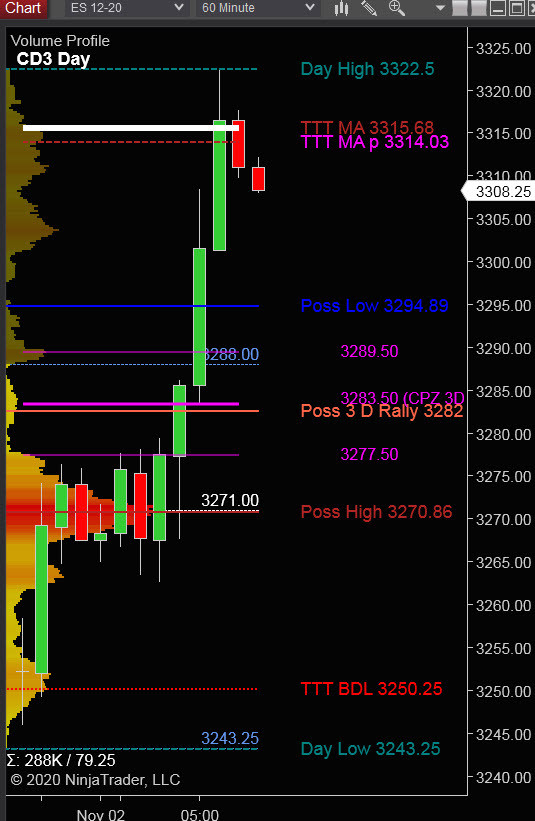
This leads us into Cycle Day 3 (CD3): Price opened Globex near the CD1 Low (3250.25) and rallied briskly, achieving 3 Day Cycle Target (3315), securing a Positive 3 Day Cycle Statistic. As such, there are two scenarios to consider for today’s trading.
1.) Price sustains a bid above 3300, initially targets 3315 – 3322 zone.
2.) Price sustains an offer below 3300, initially targets 3285 – 3270 zone.
*****3 Day Cycle has a 91% probability of fulfilling Positive Statistic covering 12 years of recorded tracking history.
PVA High Edge = 3260 PVA Low Edge = 3230 Prior POC = 3242
Range Projections and Key Levels (ES) December 2020 (Z) Contract
HOD ATR Range Projection: 3286; LOD ATR Range Projection: 3236; 3 Day Central Pivot: 3283; 3 Day Cycle Target: 3315; 10 Day Average True Range 60; VIX: 37
Nasdaq 100 (NQ)

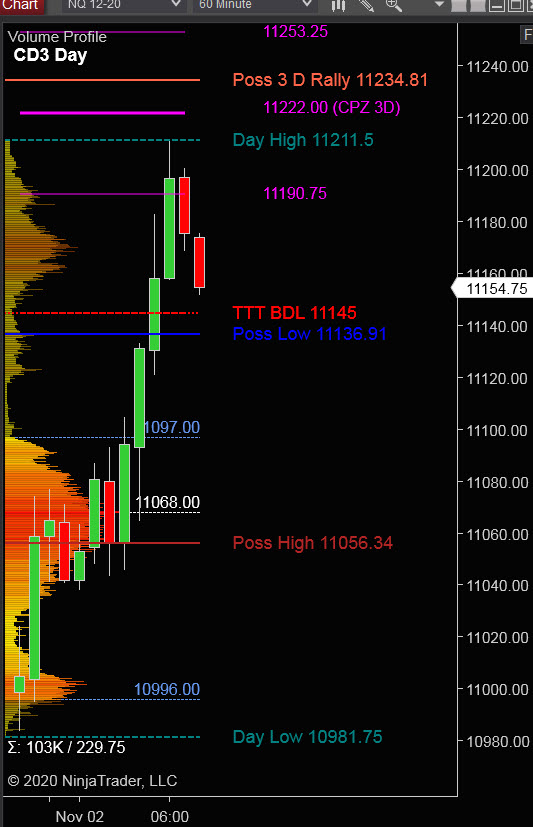
Today is Cycle Day 3 (CD3)…Price has recovered CD1 Low (11145) during overnight trade securing Positive 3 Day Cycle Statistic. For today’s trading, there are two scenarios to consider.
PVA High Edge = 11100 PVA Low Edge = 10953 Prior POC = 10998
Bull Scenario: IF Bulls sustain a bid above 11145, THEN initial upside estimate targets 11190 – 11235 zone.
Bear Scenario: IF Bears sustain an offer below 11145, THEN initial downside estimate targets 11100 – 11055 zone.
Range Projections and Key Levels (NQ) December 2020 (Z) Contract
HOD ATR Range Projection: 11233; LOD ATR Range Projection: 11028; 3 Day Central Pivot: 11222; 3 Day Cycle Target: 11235; 10 Day Average True Range: 252; VIX: 37
Trade Strategy: Our tactical trade strategy will simply remain unaltered…We’ll be flexible to trade both long and short side from Decision Pivot Levels. Continue to focus on Bull/Bear Stackers and Premium/Discounts. As always, remaining in alignment with dominant intra-day force increases probabilities of producing winning trades.
Stay Focused…Non-Biased…Disciplined ALWAYS USE STOPS!
Good Trading…David
“Knowing is not enough, We must APPLY. Willing is not enough, We must DO.” –Bruce Lee
*****This trade strategy report is disseminated for “education only” and should not be viewed in any way as a recommendation to buy or sell futures products.”
PAST PERFORMANCE IS NOT NECESSARILY INDICATIVE OF FUTURE RESULTS
IMPORTANT NOTICE! No representation is being made that the use of this strategy or any system or trading methodology will generate profits. Past performance is not necessarily indicative of future results. There is substantial risk of loss associated with trading securities and options on equities. Only risk capital should be used to trade. Trading securities is not suitable for everyone.
Disclaimer: Futures, Options, and Currency trading all have large potential rewards, but they also have large potential risk. You must be aware of the risks and be willing to accept them in order to invest in these markets. Don’t trade with money you can’t afford to lose.
This website is neither a solicitation nor an offer to Buy/Sell futures, options, or currencies. No representation is being made that any account will or is likely to achieve profits or losses similar to those discussed on this web site. The past performance of any trading system or methodology is not necessarily indicative of future results.
CFTC RULE 4.41 –HYPOTHETICAL OR SIMULATED PERFORMANCE RESULTS HAVE CERTAIN LIMITATIONS. UNLIKE AN ACTUAL PERFORMANCE RECORD, SIMULATED RESULTS DO NOT REPRESENT ACTUAL TRADING. ALSO, SINCE THE TRADES HAVE NOT BEEN EXECUTED, THE RESULTS MAY HAVE UNDER-OR-OVER COMPENSATED FOR THE IMPACT, IF ANY, OF CERTAIN MARKET FACTORS, SUCH AS LACK OF LIQUIDITY. SIMULATED TRADING PROGRAMS IN GENERAL ARE ALSO SUBJECT TO THE FACT THAT THEY ARE DESIGNED WITH THE BENEFIT OF HINDSIGHT. NO REPRESENTATION IS BEING MADE THAT ANY ACCOUNT WILL OR IS LIKELY TO ACHIEVE PROFIT OR LOSSES SIMILAR TO THOSE SHOWN