
Markets

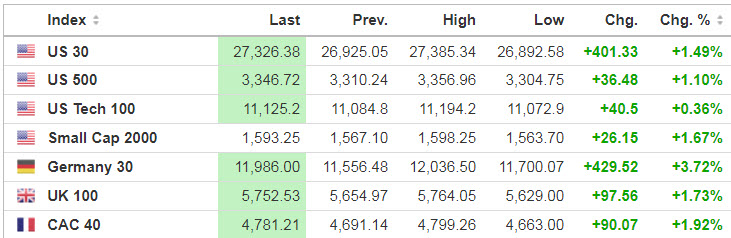
U.S. equity index futures are continuing their strong start to the week in the wake of last week’s selloff, climbing another 1.4% overnight following a green session on Monday.
Source: SeekingAlpha.com
Economic Calendar
8:55 Redbook Chain Store Sales
10:00 Factory Orders
https://www.investing.com/economic-calendar/
***New: PTG Trading Room Chat Log’s Link
S&P 500

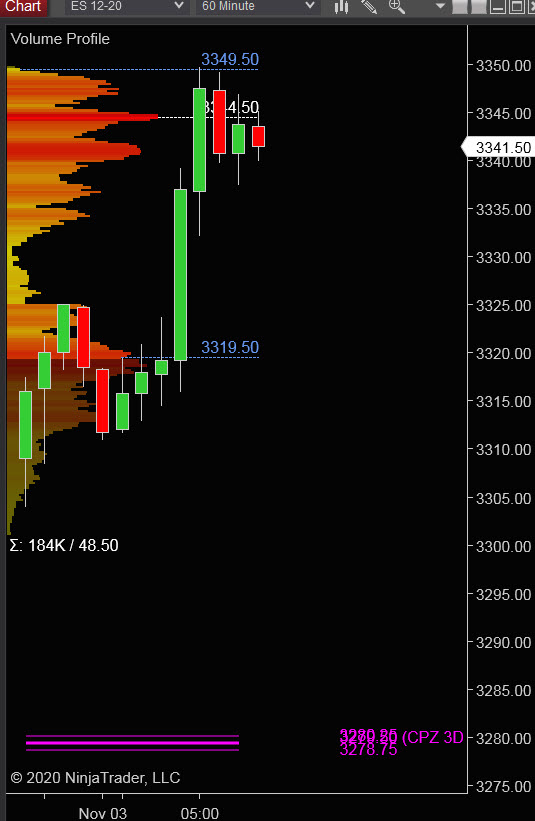
Prior Session was Cycle Day 3 (CD3): Early rally fulfilled 3 Day Cycle Objectives (3315) before reversing direction, testing 3270 key support, then reverted back to 3300 (LIS) by the close. Range was 80.25 handles on 1.811M contracts exchanged.
…Transition from Cycle Day 3 to Cycle Day 1
This leads us into Cycle Day 1 (CD1): Price is trading higher pre-RTH having already fulfilled CD1 Penetration Target (3345). Of course, today being Election Day across the USA will have price “squealin and dealin” with every vowel and syllable uttered by the media. As such, there are two scenarios to consider for today’s trading.
1.) Price sustains a bid above 3338, initially targets 3345 – 3350 zone.
2.) Price sustains an offer below 3338, initially targets 3325 – 3320 zone.
*****3 Day Cycle has a 91% probability of fulfilling Positive Statistic covering 12 years of recorded tracking history.
PVA High Edge = 3313 PVA Low Edge = 3288 Prior POC = 3303
Range Projections and Key Levels (ES) December 2020 (Z) Contract
HOD ATR Range Projection: 3363; LOD ATR Range Projection: 3288; 3 Day Central Pivot: 3280; 3 Day Cycle Target: 3334; 10 Day Average True Range 62; VIX: 36
Nasdaq 100 (NQ)

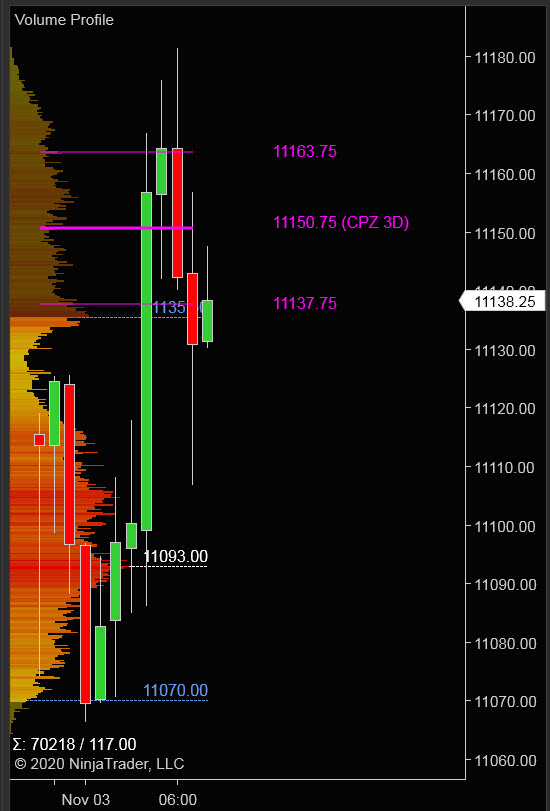
Today is Cycle Day 1 (CD1)…Normal for CD1 is decline with average measuring 10910 handle. For today’s trading, there are two scenarios to consider.
PVA High Edge = 11134 PVA Low Edge = 10980 Prior POC = 11003
Bull Scenario: IF Bulls sustain a bid above 11135, THEN initial upside estimate targets 11155 – 11175 zone.
Bear Scenario: IF Bears sustain an offer below 11135, THEN initial downside estimate targets 11110 – 11090 zone.
Range Projections and Key Levels (NQ) December 2020 (Z) Contract
HOD ATR Range Projection: 11325; LOD ATR Range Projection: 10920; 3 Day Central Pivot: 11150; 3 Day Cycle Target: 11154; 10 Day Average True Range: 261; VIX: 36
Trade Strategy: Our tactical trade strategy will simply remain unaltered…We’ll be flexible to trade both long and short side from Decision Pivot Levels. Continue to focus on Bull/Bear Stackers and Premium/Discounts. As always, remaining in alignment with dominant intra-day force increases probabilities of producing winning trades.
Stay Focused…Non-Biased…Disciplined ALWAYS USE STOPS!
Good Trading…David
“Knowing is not enough, We must APPLY. Willing is not enough, We must DO.” –Bruce Lee
*****This trade strategy report is disseminated for “education only” and should not be viewed in any way as a recommendation to buy or sell futures products.”
PAST PERFORMANCE IS NOT NECESSARILY INDICATIVE OF FUTURE RESULTS
IMPORTANT NOTICE! No representation is being made that the use of this strategy or any system or trading methodology will generate profits. Past performance is not necessarily indicative of future results. There is substantial risk of loss associated with trading securities and options on equities. Only risk capital should be used to trade. Trading securities is not suitable for everyone.
Disclaimer: Futures, Options, and Currency trading all have large potential rewards, but they also have large potential risk. You must be aware of the risks and be willing to accept them in order to invest in these markets. Don’t trade with money you can’t afford to lose.
This website is neither a solicitation nor an offer to Buy/Sell futures, options, or currencies. No representation is being made that any account will or is likely to achieve profits or losses similar to those discussed on this web site. The past performance of any trading system or methodology is not necessarily indicative of future results.
CFTC RULE 4.41 –HYPOTHETICAL OR SIMULATED PERFORMANCE RESULTS HAVE CERTAIN LIMITATIONS. UNLIKE AN ACTUAL PERFORMANCE RECORD, SIMULATED RESULTS DO NOT REPRESENT ACTUAL TRADING. ALSO, SINCE THE TRADES HAVE NOT BEEN EXECUTED, THE RESULTS MAY HAVE UNDER-OR-OVER COMPENSATED FOR THE IMPACT, IF ANY, OF CERTAIN MARKET FACTORS, SUCH AS LACK OF LIQUIDITY. SIMULATED TRADING PROGRAMS IN GENERAL ARE ALSO SUBJECT TO THE FACT THAT THEY ARE DESIGNED WITH THE BENEFIT OF HINDSIGHT. NO REPRESENTATION IS BEING MADE THAT ANY ACCOUNT WILL OR IS LIKELY TO ACHIEVE PROFIT OR LOSSES SIMILAR TO THOSE SHOWN