
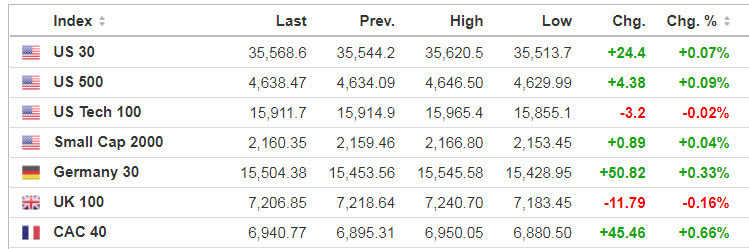
Markets
U.S. stock index futures wavered between gains and losses overnight as investors looked for direction ahead of the Federal Reserve’s latest policy meeting.
Source: SeekingAlpha.com
Economic Calendar
8:30 Retail Sales
8:30 Empire State Mfg Survey
8:30 Import/Export Prices
10:00 Business Inventories
10:00 NAHB Housing Market Index
10:00 Atlanta Fed’s Business Inflation Expectations
2:00 PM FOMC Announcement
2:30 PM Chairman Press Conference
 What to expect: While benchmark interest rates are likely to remain unchanged at 0%-0.25%, the central bank could hint to an earlier start to interest rate hikes in 2022 (though that would come in the face of new worries over the Omicron variant and the potential hit to growth). Expectations are also high that the Fed will hint at a faster tapering of asset purchases, signaling an end to easy-money policies that have helped fuel this year’s stock market rally.
 https://www.investing.com/economic-calendar/
***New: PTG Trading Room Chat Log’s Link

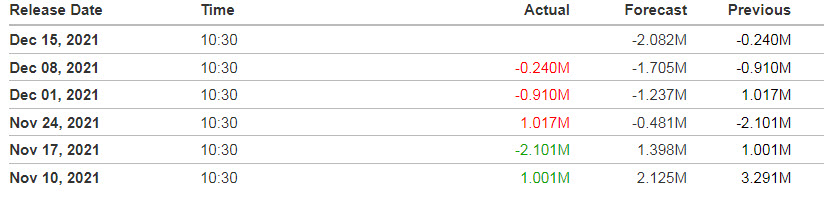
10:30 EIA Petroleum Inventories
S&P 500

***Written 8 pm Tuesday evening for Wednesday’s trading for contribution to MrTopStep’s “The Opening Print” publication.
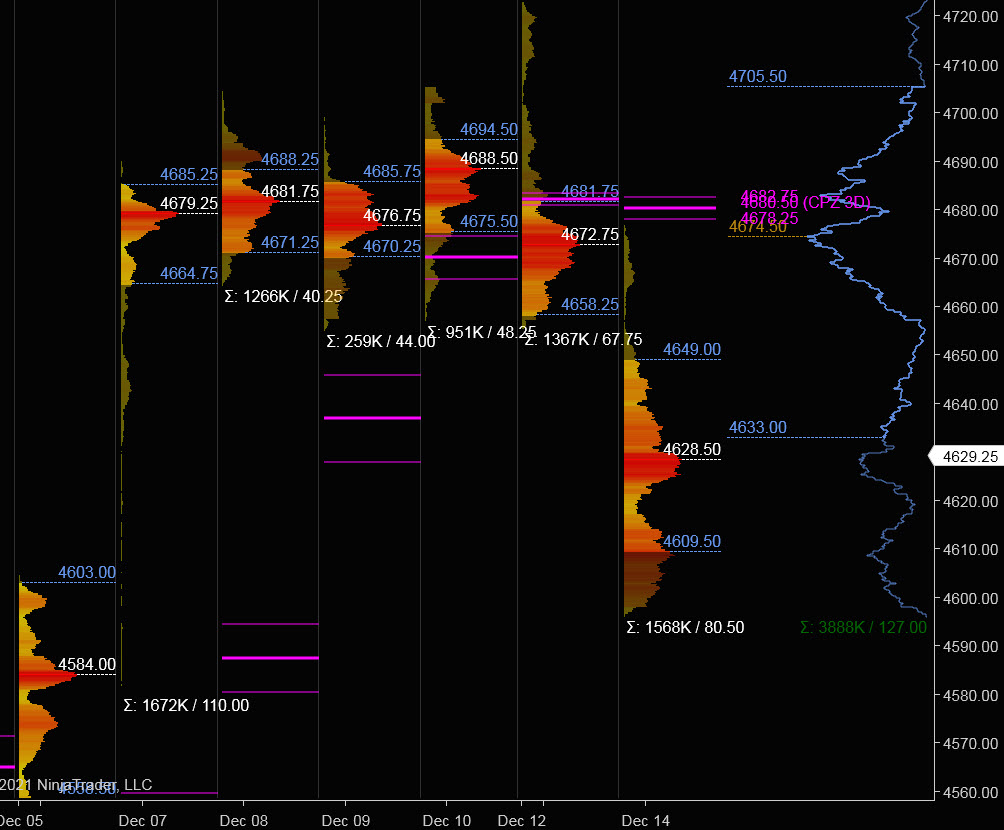
Tuesday’s Session was Cycle Day 1 (CD1): Price continued its decline which began on prior Cycle Day 3, selling down to Key VPOC (4595) as well as Key Gamma Volatility Trigger (4603). Range was 80.50 handles on 1.569M contracts exchanged.
…Transition from Cycle Day 1 to Cycle Day 2
This leads us into Cycle Day 2 (CD2): Price has rebounded back to more balanced neutral levels near 4630 handle. Being a CD2, normal expectation would be for consolidation of recent activity. Moreover, today is FOMC, which can always be a “wild-card” for direction. As such, estimated scenarios to consider for today’s trading.
1.) Price sustains a bid above 4630, initially targets 4655 – 4650 zone.
2.) Price sustains an offer below 4630, initially targets 4610 – 4600 zone.
*****The 3 Day Cycle has a 91% probability of fulfilling Positive Cycle Statistics covering 12 years of recorded tracking history.
For more detailed information for both bullish and bearish projected targets, please visit: PTG 3 Day Cycle and/or reference the Cycle Spreadsheet below:
Link to access full Cycle Spreadsheet > > Cycle Day 2 (CD2)

PVA High Edge = 4649 PVA Low Edge = 4610 Prior POC = 4628
Range Projections and Key Levels (ES) March 2022 (H) Contract
HOD ATR Range Projection: 4686; LOD ATR Range Projection: 4572; 3 Day Central Pivot: 4667; 3 Day Cycle Target: 4671; 10 Day Average True Range 66; VIX: 21.75
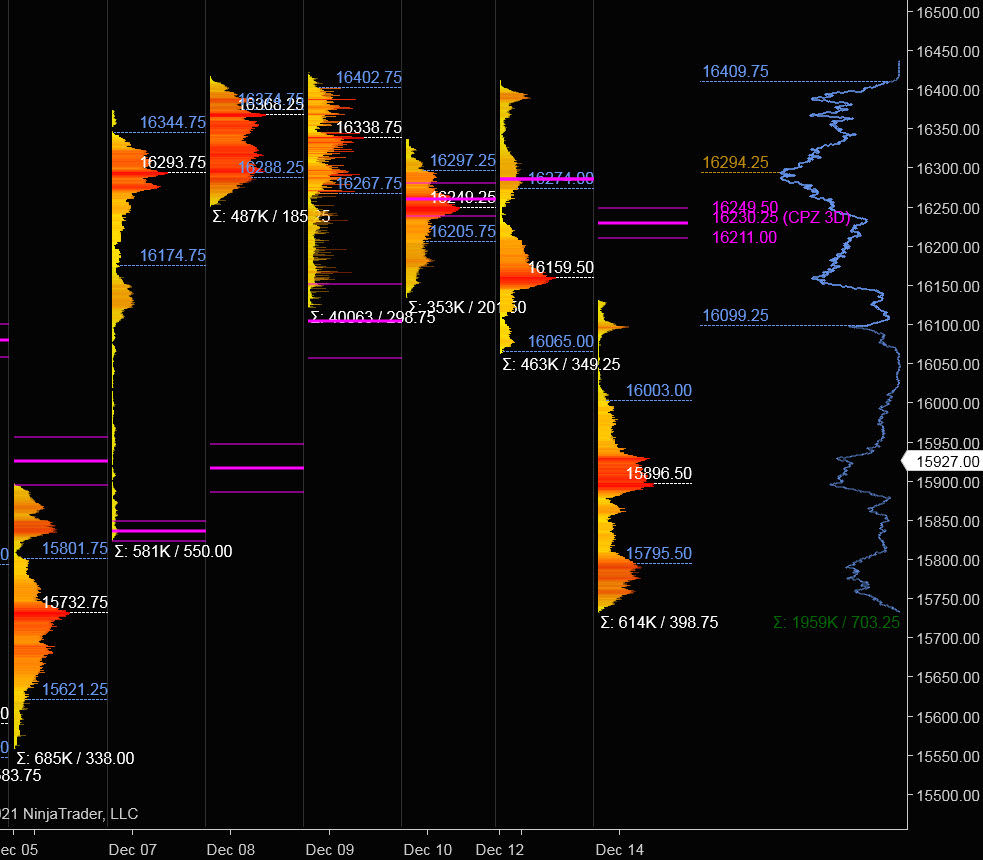
Nasdaq 100 (NQ)

Today is Cycle Day 2 (CD2)…Price has rebounded from deep CD1 Low (15734) and trading in more neutral balance near 15930 handle. Prior range was 399 handles on 614k contracts exchanged. As such, there are two estimated scenarios to consider for today’s trading.
PVA High Edge = 16003 PVA Low Edge = 15795 Prior POC = 15896
Bull Scenario: IF Bulls sustain a bid above 15925, THEN initial upside estimate targets 16000 – 16020 zone.
Bear Scenario: IF Bears sustain an offer below 15925, THEN initial downside estimate targets 15850 – 15810 zone.
Range Projections and Key Levels (NQ) March 2022 (H) Contract
HOD ATR Range Projection: 16158; LOD ATR Range Projection: 15552; 3 Day Central Pivot: 16130; 3 Day Cycle Target: 16074; 10 Day Average True Range: 309; VIX: 21.75
Trade Strategy: Our tactical trade strategy will simply remain unaltered…We’ll be flexible to trade both long and short side from Decision Pivot Levels. Continue to focus on Bull/Bear Stackers and Premium/Discounts. As always, remaining in alignment with dominant intra-day force increases probabilities of producing winning trades.
Stay Focused…Non-Biased…Disciplined ALWAYS USE STOPS!
Good Trading…David
“Knowing is not enough, We must APPLY. Willing is not enough, We must DO.” –Bruce Lee
*****This trade strategy report is disseminated for “education only” and should not be viewed in any way as a recommendation to buy or sell futures products.”
PAST PERFORMANCE IS NOT NECESSARILY INDICATIVE OF FUTURE RESULTS
IMPORTANT NOTICE! No representation is being made that the use of this strategy or any system or trading methodology will generate profits. Past performance is not necessarily indicative of future results. There is substantial risk of loss associated with trading securities and options on equities. Only risk capital should be used to trade. Trading securities is not suitable for everyone.
Disclaimer: Futures, Options, and Currency trading all have large potential rewards, but they also have large potential risk. You must be aware of the risks and be willing to accept them in order to invest in these markets. Don’t trade with money you can’t afford to lose.
This website is neither a solicitation nor an offer to Buy/Sell futures, options, or currencies. No representation is being made that any account will or is likely to achieve profits or losses similar to those discussed on this web site. The past performance of any trading system or methodology is not necessarily indicative of future results.
CFTC RULE 4.41 –HYPOTHETICAL OR SIMULATED PERFORMANCE RESULTS HAVE CERTAIN LIMITATIONS. UNLIKE AN ACTUAL PERFORMANCE RECORD, SIMULATED RESULTS DO NOT REPRESENT ACTUAL TRADING. ALSO, SINCE THE TRADES HAVE NOT BEEN EXECUTED, THE RESULTS MAY HAVE UNDER-OR-OVER COMPENSATED FOR THE IMPACT, IF ANY, OF CERTAIN MARKET FACTORS, SUCH AS LACK OF LIQUIDITY. SIMULATED TRADING PROGRAMS IN GENERAL ARE ALSO SUBJECT TO THE FACT THAT THEY ARE DESIGNED WITH THE BENEFIT OF HINDSIGHT. NO REPRESENTATION IS BEING MADE THAT ANY ACCOUNT WILL OR IS LIKELY TO ACHIEVE PROFIT OR LOSSES SIMILAR TO THOSE SHOWN