
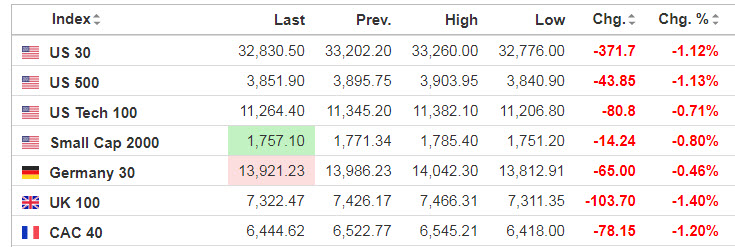
Markets
Worries about the future of Federal Reserve policy are intensifying, fueling a substantial selloff on Wall Street on Thursday. The Dow Jones Industrial Average tumbled 764 points to log its worst day in three months, while the S&P 500 and Nasdaq dropped 2.5% and 3.3%, respectively.
Source: SeekingAlpha.com
Economic Calendar
9:45 PMI Composite Flash
12:00 PM Fed’s Daly Speech
1:00 PM Baker-Hughes Rig Count
https://www.investing.com/economic-calendar/
***New: PTG Trading Room Chat Log’s Link
S&P 500

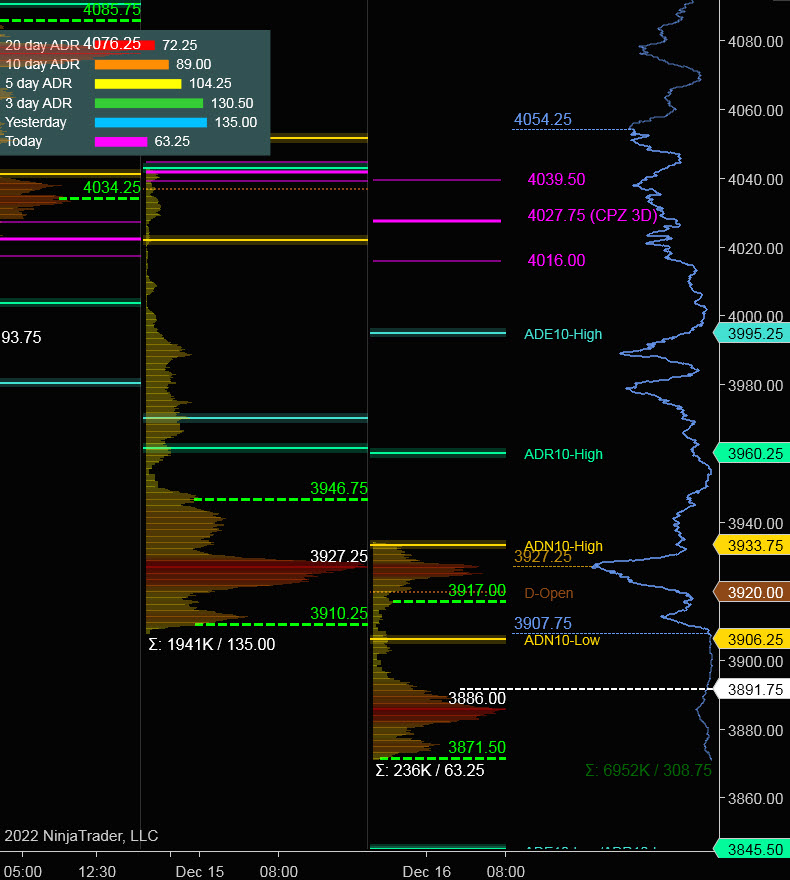
Prior Session was Cycle Day 3 (CD3): Risk-Off sentiment continued as trend down dominated the session. Prior range was 135 handles on 1.941M contracts exchanged.
…Transition from Cycle Day 3 to Cycle Day 1
This leads us into Cycle Day 1 (CD1): Average Decline for CD1 measures 3963 which has been grossly exceeded. Normal for CD1 is a decline to find a new secure cycle low. Overnight and pre-RTH price is extending this current trend down, trading as low as 3871 handle. OPEX today with over $3 trillion of expiring options. As such, estimated scenarios to consider for today’s trading.
Bull Scenario: Price sustains a bid above 3910, initially targets 3940 – 3950 zone.
Bear Scenario: Price sustains an offer below 3910, initially targets 3875 – 3870 zone.
PVA High Edge = 3947 PVA Low Edge = 3910 Prior POC = 3928
Range Projections and Key Levels (ES) March 2023 (H) Contract
HOD ATR Range Projection: 3960; LOD ATR Range Projection: 3845; 3 Day Central Pivot: 4028; 3 Day Cycle Target: 3996; 10 Day Average True Range 89; VIX: 23
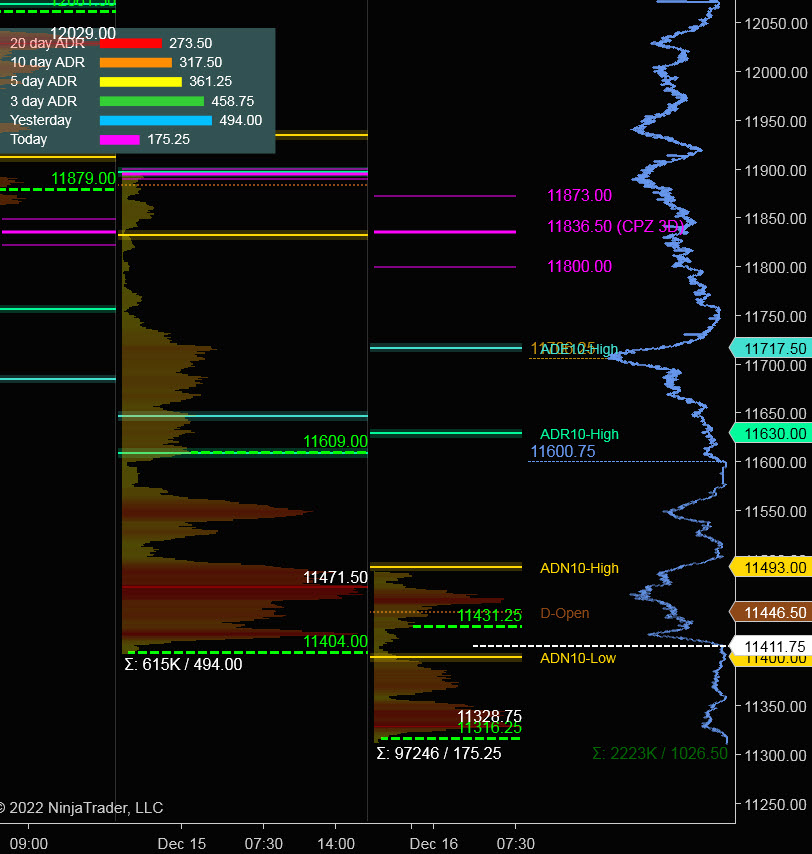
Nasdaq 100 (NQ)

Today is Cycle Day 1 (CD1)…Average Decline for CD1 measures 11574 which has been grossly exceeded. Normal for CD1 is a decline to find a new secure cycle low. Overnight and pre-RTH price is extending this current trend down, trading as low as 11312 handle. OPEX today with over $3 trillion of expiring options. As such, estimated scenarios to consider for today’s trading.
Bull Scenario: IF Bulls sustains bid above 11404, THEN initial upside estimate targets 11515– 11535 zone.
Bear Scenario: IF Bears sustains offer below 11404, THEN initial downside estimate targets 11300 – 11280 zone.
PVA High Edge = 11609 PVA Low Edge = 11404 Prior POC = 11472
Range Projections and Key Levels (NQ) March 2023 (H) Contract
HOD ATR Range Projection: 11628; LOD ATR Range Projection: 1172; 3 Day Central Pivot: 11836; 3 Day Cycle Target: 11780; 10 Day Average True Range: 317; VIX: 23
Trade Strategy: Our tactical trade strategy will simply remain unaltered…We’ll be flexible to trade both long and short side from Decision Pivot Levels. Continue to focus on Bull/Bear Stackers and Premium/Discounts. As always, remaining in alignment with dominant intra-day force increases probabilities of producing winning trades.
Stay Focused…Non-Biased…Disciplined ALWAYS USE STOPS!
Good Trading…David
“Knowing is not enough, We must APPLY. Willing is not enough, We must DO.” –Bruce Lee
*****This trade strategy report is disseminated for “education only” and should not be viewed in any way as a recommendation to buy or sell futures products.”
PAST PERFORMANCE IS NOT NECESSARILY INDICATIVE OF FUTURE RESULTS
IMPORTANT NOTICE! No representation is being made that the use of this strategy or any system or trading methodology will generate profits. Past performance is not necessarily indicative of future results. There is substantial risk of loss associated with trading securities and options on equities. Only risk capital should be used to trade. Trading securities is not suitable for everyone.
Disclaimer: Futures, Options, and Currency trading all have large potential rewards, but they also have large potential risk. You must be aware of the risks and be willing to accept them in order to invest in these markets. Don’t trade with money you can’t afford to lose.
This website is neither a solicitation nor an offer to Buy/Sell futures, options, or currencies. No representation is being made that any account will or is likely to achieve profits or losses similar to those discussed on this web site. The past performance of any trading system or methodology is not necessarily indicative of future results.
CFTC RULE 4.41 –HYPOTHETICAL OR SIMULATED PERFORMANCE RESULTS HAVE CERTAIN LIMITATIONS. UNLIKE AN ACTUAL PERFORMANCE RECORD, SIMULATED RESULTS DO NOT REPRESENT ACTUAL TRADING. ALSO, SINCE THE TRADES HAVE NOT BEEN EXECUTED, THE RESULTS MAY HAVE UNDER-OR-OVER COMPENSATED FOR THE IMPACT, IF ANY, OF CERTAIN MARKET FACTORS, SUCH AS LACK OF LIQUIDITY. SIMULATED TRADING PROGRAMS IN GENERAL ARE ALSO SUBJECT TO THE FACT THAT THEY ARE DESIGNED WITH THE BENEFIT OF HINDSIGHT. NO REPRESENTATION IS BEING MADE THAT ANY ACCOUNT WILL OR IS LIKELY TO ACHIEVE PROFIT OR LOSSES SIMILAR TO THOSE SHOWN