
Markets
With momentum building before the holidays and the S&P 500 recording its 68th record close of 2021, traders are keeping their eyes on the chimney to see if the so-called Santa Claus rally will take shape this year. The seasonally bullish trend typically sees equities rise over the last five trading sessions of December and the first two trading days of January. Since 1928, the S&P 500 has been positive in that stretch 78.5% of the time, according to data from Bank of America. Futures movement: Dow +0.1%; S&P 500 +0.2%; Nasdaq +0.3%.

Source: SeekingAlpha.com
Economic Calendar
10:30 Dallas Fed Manufacturing Survey
1:00 PM Results of $56B, 2-Year Note Auction
https://www.investing.com/economic-calendar/
***New: PTG Trading Room Chat Log’s Link
S&P 500

Prior Session was Cycle Day 2 (CD2): Trend Day up marked this cycle day as traders were bullish ahead on the Xmas holiday and shortened trading week. Range was 47 handles on 923k contracts exchanged.
…Transition from Cycle Day 2 to Cycle Day 3
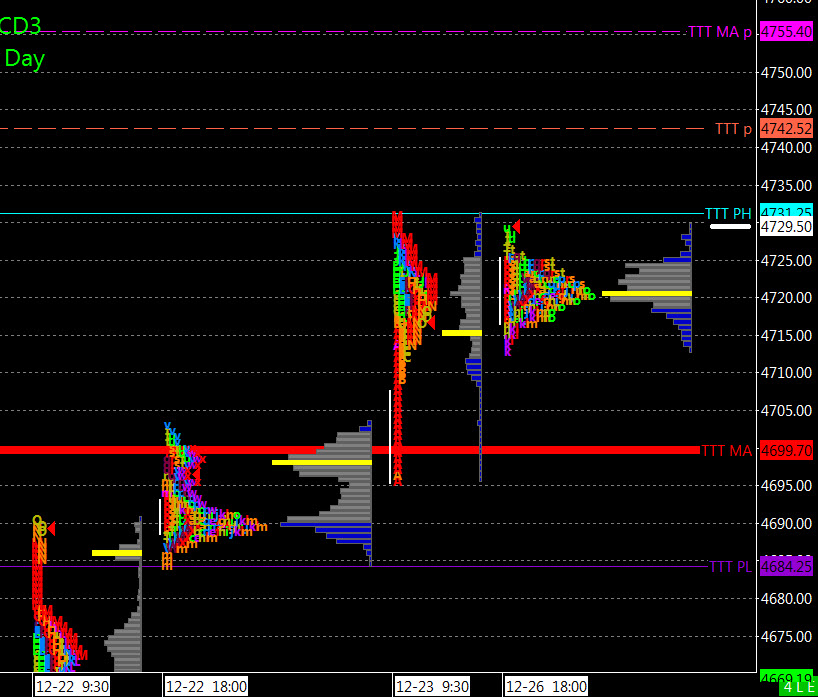
This leads us into Cycle Day 3 (CD3): Cycle Statistics have been fulfilled, so we’ll mark today as a “wild-card” with bulls having total ball control heading into the last trading week of 2021. As such, estimated scenarios to consider for today’s trading.
1.) Price sustains a bid above 4720, initially targets 4732 – 4742 zone.
2.) Price sustains an offer below 4720, initially targets 4712 – 4710 zone.
*****The 3 Day Cycle has a 91% probability of fulfilling Positive Cycle Statistics covering 12 years of recorded tracking history.
PVA High Edge = 4725 PVA Low Edge = 4710 Prior POC = 4720
Range Projections and Key Levels (ES) March 2022 (H) Contract
HOD ATR Range Projection: 4788; LOD ATR Range Projection: 4652; 3 Day Central Pivot: 4665; 3 Day Cycle Target: 4700; 10 Day Average True Range 75; VIX: 19
Nasdaq 100 (NQ)

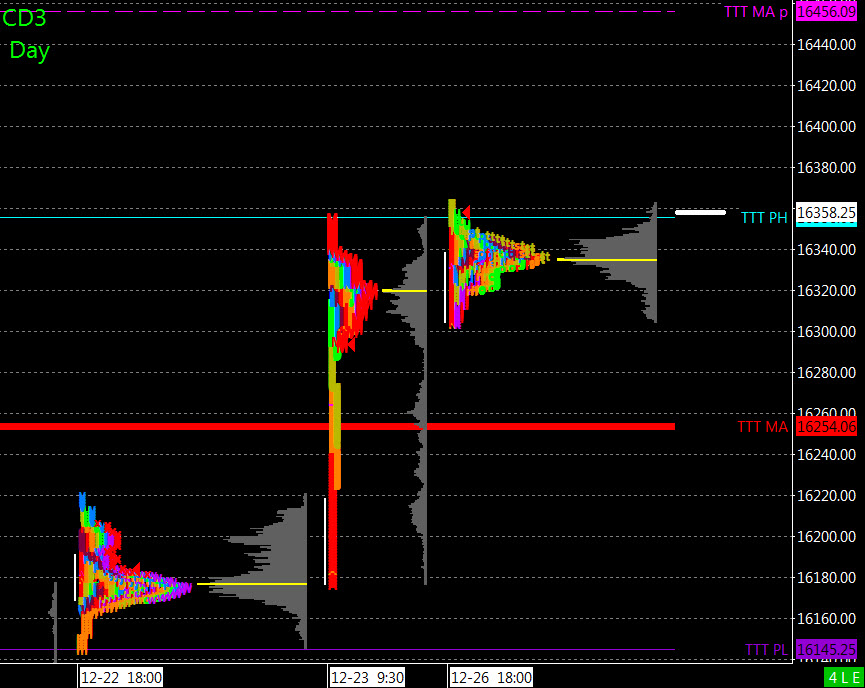
Today is Cycle Day 3 (CD3)…Traders will be looking for the Santa Rally to end this year out at or near all-time highs. Prior range was 210 handles on 341k contracts exchanged. As such, there are two estimated scenarios to consider for today’s trading.
PVA High Edge = 16356 PVA Low Edge = 16230 Prior POC = 16318
Bull Scenario: IF Bulls sustain a bid above 16318, THEN initial upside estimate targets 16363 – 16391 zone.
Bear Scenario: IF Bears sustain an offer below 16318, THEN initial downside estimate targets 16285 – 16268 zone.
Range Projections and Key Levels (NQ) March 2022 (H) Contract
HOD ATR Range Projection: 16654; LOD ATR Range Projection: 16013; 3 Day Central Pivot: 16068; 3 Day Cycle Target: 16254; 10 Day Average True Range: 350; VIX: 19
Trade Strategy: Our tactical trade strategy will simply remain unaltered…We’ll be flexible to trade both long and short side from Decision Pivot Levels. Continue to focus on Bull/Bear Stackers and Premium/Discounts. As always, remaining in alignment with dominant intra-day force increases probabilities of producing winning trades.
Stay Focused…Non-Biased…Disciplined ALWAYS USE STOPS!
Good Trading…David
“Knowing is not enough, We must APPLY. Willing is not enough, We must DO.” –Bruce Lee
*****This trade strategy report is disseminated for “education only” and should not be viewed in any way as a recommendation to buy or sell futures products.”
PAST PERFORMANCE IS NOT NECESSARILY INDICATIVE OF FUTURE RESULTS
IMPORTANT NOTICE! No representation is being made that the use of this strategy or any system or trading methodology will generate profits. Past performance is not necessarily indicative of future results. There is substantial risk of loss associated with trading securities and options on equities. Only risk capital should be used to trade. Trading securities is not suitable for everyone.
Disclaimer: Futures, Options, and Currency trading all have large potential rewards, but they also have large potential risk. You must be aware of the risks and be willing to accept them in order to invest in these markets. Don’t trade with money you can’t afford to lose.
This website is neither a solicitation nor an offer to Buy/Sell futures, options, or currencies. No representation is being made that any account will or is likely to achieve profits or losses similar to those discussed on this web site. The past performance of any trading system or methodology is not necessarily indicative of future results.
CFTC RULE 4.41 –HYPOTHETICAL OR SIMULATED PERFORMANCE RESULTS HAVE CERTAIN LIMITATIONS. UNLIKE AN ACTUAL PERFORMANCE RECORD, SIMULATED RESULTS DO NOT REPRESENT ACTUAL TRADING. ALSO, SINCE THE TRADES HAVE NOT BEEN EXECUTED, THE RESULTS MAY HAVE UNDER-OR-OVER COMPENSATED FOR THE IMPACT, IF ANY, OF CERTAIN MARKET FACTORS, SUCH AS LACK OF LIQUIDITY. SIMULATED TRADING PROGRAMS IN GENERAL ARE ALSO SUBJECT TO THE FACT THAT THEY ARE DESIGNED WITH THE BENEFIT OF HINDSIGHT. NO REPRESENTATION IS BEING MADE THAT ANY ACCOUNT WILL OR IS LIKELY TO ACHIEVE PROFIT OR LOSSES SIMILAR TO THOSE SHOWN