
Markets
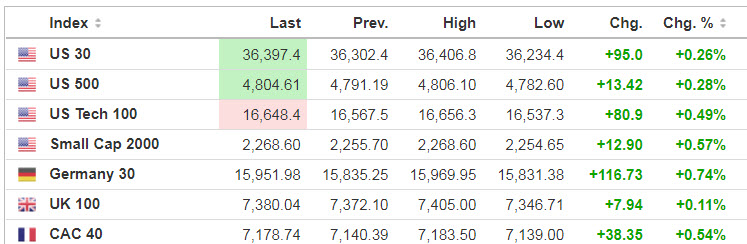
Source: SeekingAlpha.com
Economic Calendar
8:55 Redbook Chain Store Sales
9:00 S&P CoreLogic Case-Shiller Home Price Index
9:00 FHFA House Price Index
10:00 Richmond Fed Mfg.
1:00 PM Results of $61B, 5-Year Note Auction
1:00 PM Money Supply
https://www.investing.com/economic-calendar/
***New: PTG Trading Room Chat Log’s Link
S&P 500

Prior Session was Cycle Day 3 (CD3): The infamous “Santa Rally” appears to have taken flight right on cue, as “Mutual Fund Monday” gap open never looked back. Strong and persistent, albeit light volume (THIN TO WIN) rally barely gave traders an opportunity to get onboard, until the classic end of day “Dip n Rip” coupled with MOC Buy Imbalance of $1.3B propelled price to all-time closing highs. Range was 71 handles on 852k contracts exchanged.
…Transition from Cycle Day 3 to Cycle Day 1
This leads us into Cycle Day 1 (CD1): Today begins a new cycle, with the Average Decline measuring 4720. Price has cleared prior high (4784.25) fulfilling CD1 Penetration Level (4795.50) during overnight trade activity. As such, estimated scenarios to consider for today’s trading.
1.) Price sustains a bid above 4784, initially targets 4795 – 4807 zone.
2.) Price sustains an offer below 4784, initially targets 4774 – 4769 zone.
*****3 Day Cycle has a 91% probability of fulfilling Positive Cycle Statistics covering 12 years of recorded tracking history.
PVA High Edge = 4784 PVA Low Edge = 4751 Prior POC = 4781
Range Projections and Key Levels (ES) March 2022 (H) Contract
HOD ATR Range Projection: 4848; LOD ATR Range Projection: 4723; 3 Day Central Pivot: 4713; 3 Day Cycle Target: 4795; 10 Day Average True Range; 74; VIX: 17

Nasdaq 100 (NQ)

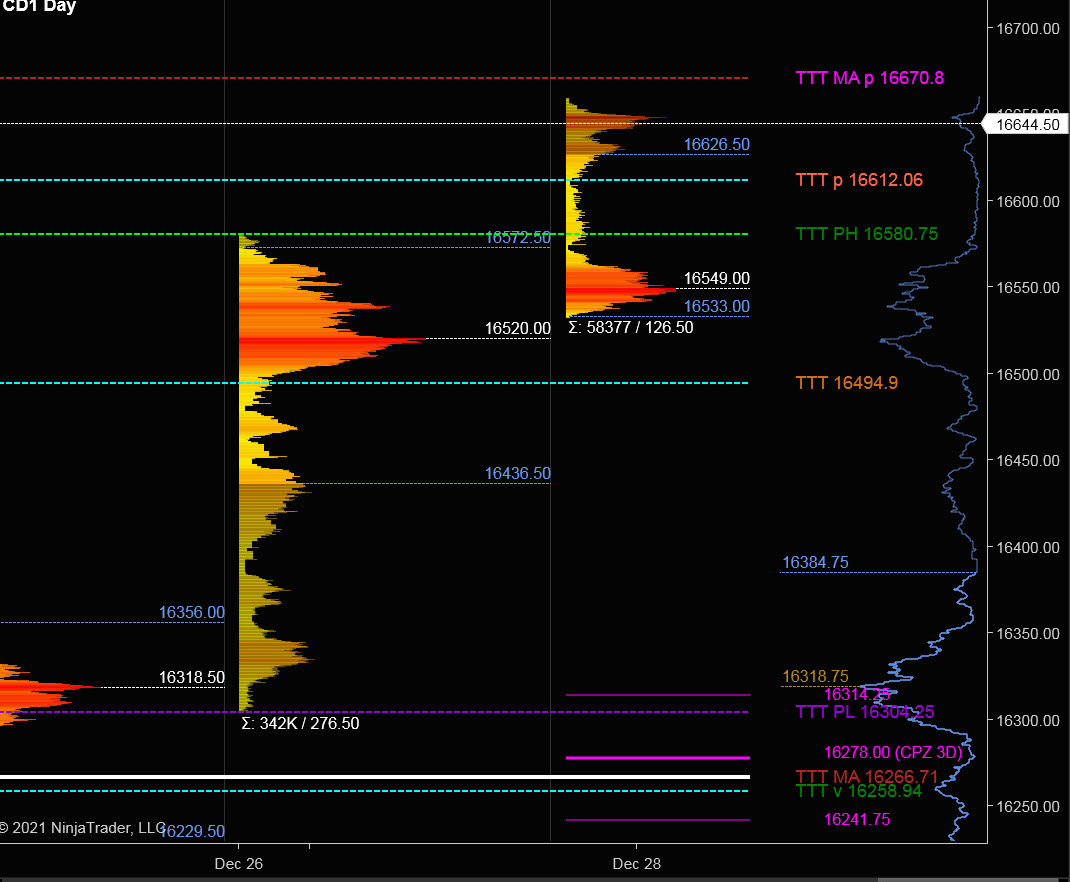
Today is Cycle Day 1 (CD1)…Price is extending prior session gains above prior high (16580.75) during overnight trade activity. Prior range was 277 handles on 342k contracts exchanged. As such, there are two estimated scenarios to consider for today’s trading.
PVA High Edge = 16572 PVA Low Edge = 16436 Prior POC = 16520
Bull Scenario: IF Bulls sustain a bid above 16580, THEN initial upside estimate targets 16612 – 16670 zone.
Bear Scenario: IF Bears sustain an offer below 16580, THEN initial downside estimate targets 16550– 16520 zone.
Range Projections and Key Levels (NQ) March 2022 (H) Contract
HOD ATR Range Projection: 16870; LOD ATR Range Projection: 16322; 3 Day Central Pivot: 16278; 3 Day Cycle Target: 16670; 10 Day Average True Range: 337; VIX: 17
Trade Strategy: Our tactical trade strategy will simply remain unaltered…We’ll be flexible to trade both long and short side from Decision Pivot Levels. Continue to focus on Bull/Bear Stackers and Premium/Discounts. As always, remaining in alignment with dominant intra-day force increases probabilities of producing winning trades.
Stay Focused…Non-Biased…Disciplined ALWAYS USE STOPS!
Good Trading…David
“Knowing is not enough, We must APPLY. Willing is not enough, We must DO.” –Bruce Lee
*****This trade strategy report is disseminated for “education only” and should not be viewed in any way as a recommendation to buy or sell futures products.”
PAST PERFORMANCE IS NOT NECESSARILY INDICATIVE OF FUTURE RESULTS
IMPORTANT NOTICE! No representation is being made that the use of this strategy or any system or trading methodology will generate profits. Past performance is not necessarily indicative of future results. There is substantial risk of loss associated with trading securities and options on equities. Only risk capital should be used to trade. Trading securities is not suitable for everyone.
Disclaimer: Futures, Options, and Currency trading all have large potential rewards, but they also have large potential risk. You must be aware of the risks and be willing to accept them in order to invest in these markets. Don’t trade with money you can’t afford to lose.
This website is neither a solicitation nor an offer to Buy/Sell futures, options, or currencies. No representation is being made that any account will or is likely to achieve profits or losses similar to those discussed on this web site. The past performance of any trading system or methodology is not necessarily indicative of future results.
CFTC RULE 4.41 –HYPOTHETICAL OR SIMULATED PERFORMANCE RESULTS HAVE CERTAIN LIMITATIONS. UNLIKE AN ACTUAL PERFORMANCE RECORD, SIMULATED RESULTS DO NOT REPRESENT ACTUAL TRADING. ALSO, SINCE THE TRADES HAVE NOT BEEN EXECUTED, THE RESULTS MAY HAVE UNDER-OR-OVER COMPENSATED FOR THE IMPACT, IF ANY, OF CERTAIN MARKET FACTORS, SUCH AS LACK OF LIQUIDITY. SIMULATED TRADING PROGRAMS IN GENERAL ARE ALSO SUBJECT TO THE FACT THAT THEY ARE DESIGNED WITH THE BENEFIT OF HINDSIGHT. NO REPRESENTATION IS BEING MADE THAT ANY ACCOUNT WILL OR IS LIKELY TO ACHIEVE PROFIT OR LOSSES SIMILAR TO THOSE SHOWN