
Markets (Top Stories)

Source: SeekingAlpha.com
Economic Calendar

https://www.investing.com/economic-calendar/

Investing.com — U.S. crude inventory unexpectedly increased last week, the API reported Tuesday, adding to concerns about a potential global crude supply surplus following weaker-than-expected pledges to cut output by major oil producers last week.
U.S. crude inventories rose by 594,000 barrels for the week ended Dec. 1, compared with a draw of 817,000 million barrels reported by the API for the previous week. Economists were expecting an decline of about 2.3M barrels.
The official government inventory report due Wednesday is expected to show weekly U.S. crude supplies decreased by about 2.9M barrels last week.

S&P 500

***Written Tuesday evening for Wednesday’s trading for contribution to MrTopStep’s “The Opening Print” publication.
Prior Session was Cycle Day 1 (CD1): Normal CD1 as price declined establishing a cycle low at 4555.50. Prior range was 30 handles on 1.777M contracts exchanged.
…Transition from Cycle Day 1 to Cycle Day 2
This leads us into Cycle Day 2 (CD2): No structural change in dynamics, as price remains confined to multi-day composite range. Key parameters are unchanged at 4555 – 4575. We remain committed to managing risk and not overtrading these rhythms, until a more directional lean unfolds. As such, scenarios to consider for today’s trading.
Bull Scenario: Price sustains a bid above 4575, initially targets 4590 – 4595 zone.
Bear Scenario: Price sustains an offer below 4555, initially targets 4535 – 4530 zone.
PVA High Edge = 4577 PVA Low Edge = 4567 Prior POC = 4557
*****The 3 Day Cycle has a 91% probability of fulfilling Positive Cycle Statistics covering 12 years of recorded tracking history.
For more detailed information for both bullish and bearish projected targets, please visit: PTG 3 Day Cycle and/or reference the Cycle Spreadsheet below:
Link to access full Cycle Spreadsheet > > Cycle Day 2 (CD2)
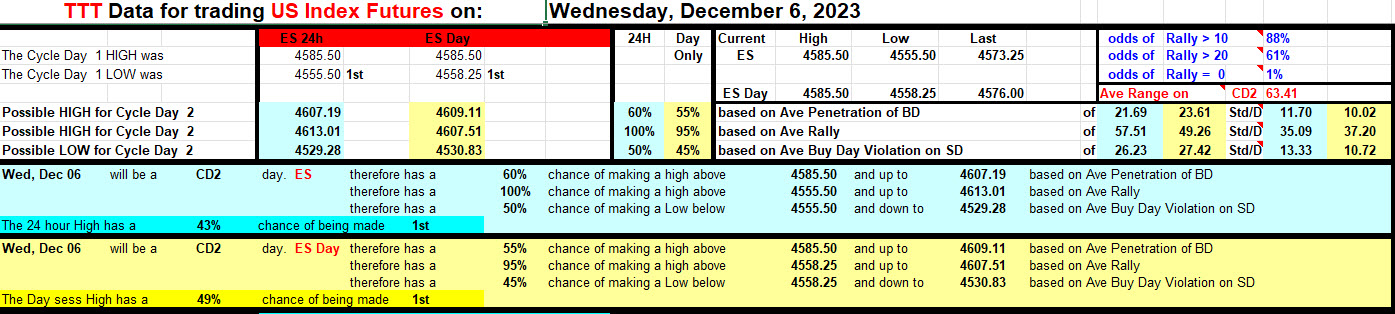
Range Projections and Key Levels (ES) December 2023 (Z) Contract
HOD ATR Range Projection: 46004; LOD ATR Range Projection: 4544; 3 Day Central Pivot: 4578; 3 Day Cycle Target: 4596; 10 Day Average True Range 33; VIX: 13

Nasdaq 100 (NQ)

Prior Session was Cycle Day 1 (CD1): Normal CD1 as price declined establishing a cycle low at 15761.25. Prior range was 199 handles on 672k contracts exchanged.
…Transition from Cycle Day 1 to Cycle Day 2
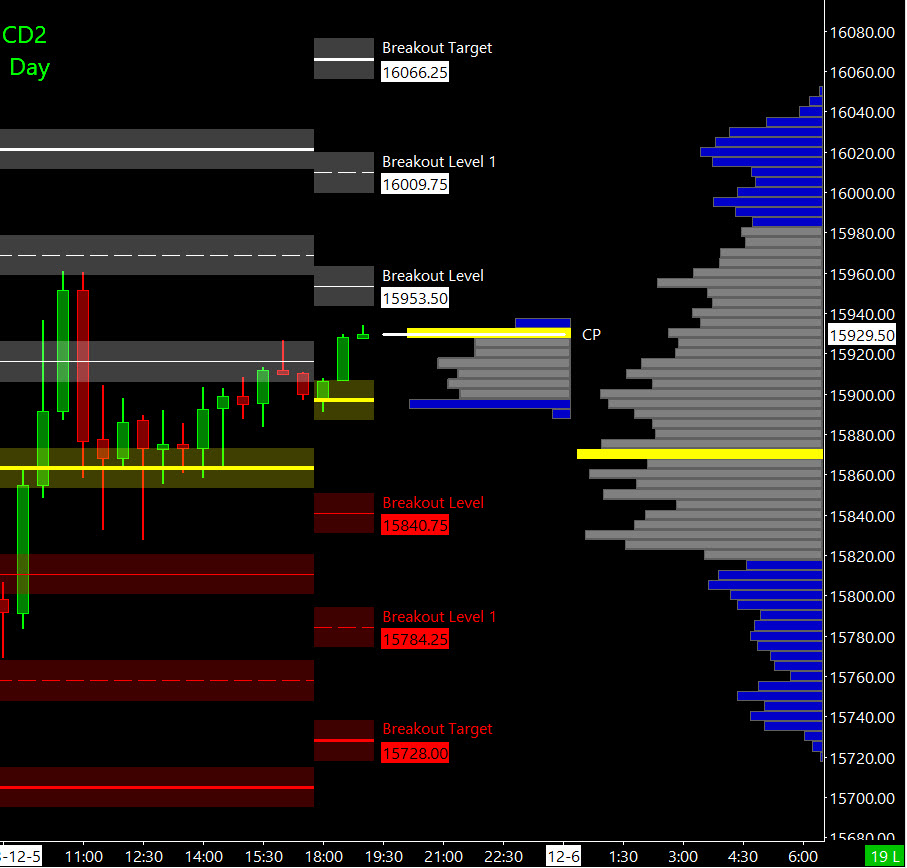
This leads us into Cycle Day 2 (CD2): No structural change in dynamics, as price remains confined to multi-day composite range. Key parameters are unchanged at 15720 – 15960. We remain committed to managing risk and not overtrading these rhythms, until a more directional lean unfolds. As such, scenarios to consider for today’s trading.
Bull Scenario: Price sustains a bid above 15900, initially targets 15980 – 16000 zone.
Bear Scenario: Price sustains an offer below 15900, initially targets 15840 – 15820 zone.
PVA High Edge = 15922 PVA Low Edge = 15832 Prior POC = 15897
Range Projections and Key Levels (NQ) December 2023 (Z) Contract
HOD ATR Range Projection: 16086; LOD ATR Range Projection: 15726; 3 Day Central Pivot: 15937; 3 Day Cycle Target: 16041; 10 Day Average True Range: 195; VIX: 13
Trade Strategy: Our tactical trade strategy will simply remain unaltered…We’ll be flexible to trade both long and short side from Decision Pivot Levels. Continue to focus on Bull/Bear Stackers and Premium/Discounts. As always, remaining in alignment with dominant intra-day force increases probabilities of producing winning trades.
Stay Focused…Non-Biased…Disciplined ALWAYS USE STOPS!
Good Trading…David
“Knowing is not enough, We must APPLY. Willing is not enough, We must DO.” –Bruce Lee
*****This trade strategy report is disseminated for “education only” and should not be viewed in any way as a recommendation to buy or sell futures products.”
PAST PERFORMANCE IS NOT NECESSARILY INDICATIVE OF FUTURE RESULTS
IMPORTANT NOTICE! No representation is being made that the use of this strategy or any system or trading methodology will generate profits. Past performance is not necessarily indicative of future results. There is substantial risk of loss associated with trading securities and options on equities. Only risk capital should be used to trade. Trading securities is not suitable for everyone.
Disclaimer: Futures, Options, and Currency trading all have large potential rewards, but they also have large potential risk. You must be aware of the risks and be willing to accept them in order to invest in these markets. Don’t trade with money you can’t afford to lose.
This website is neither a solicitation nor an offer to Buy/Sell futures, options, or currencies. No representation is being made that any account will or is likely to achieve profits or losses similar to those discussed on this web site. The past performance of any trading system or methodology is not necessarily indicative of future results.
CFTC RULE 4.41 –HYPOTHETICAL OR SIMULATED PERFORMANCE RESULTS HAVE CERTAIN LIMITATIONS. UNLIKE AN ACTUAL PERFORMANCE RECORD, SIMULATED RESULTS DO NOT REPRESENT ACTUAL TRADING. ALSO, SINCE THE TRADES HAVE NOT BEEN EXECUTED, THE RESULTS MAY HAVE UNDER-OR-OVER COMPENSATED FOR THE IMPACT, IF ANY, OF CERTAIN MARKET FACTORS, SUCH AS LACK OF LIQUIDITY. SIMULATED TRADING PROGRAMS IN GENERAL ARE ALSO SUBJECT TO THE FACT THAT THEY ARE DESIGNED WITH THE BENEFIT OF HINDSIGHT. NO REPRESENTATION IS BEING MADE THAT ANY ACCOUNT WILL OR IS LIKELY TO ACHIEVE PROFIT OR LOSSES SIMILAR TO THOSE SHOWN