
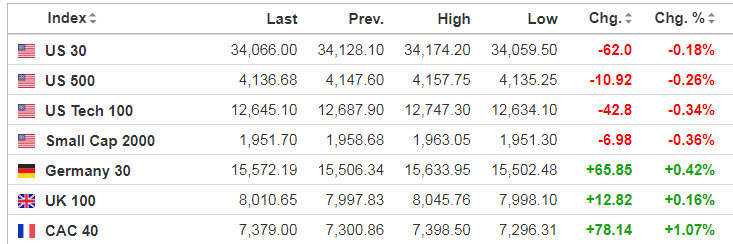
Markets
Economic Calendar
8:30 Housing Starts and Permits
8:30 Initial Jobless Claims
8:30 Philly Fed Business Outlook
8:30 Producer Price Index
8:45 Fed’s Mester Speech
10:30 EIA Natural Gas Inventory
1:30 PM Fed’s Bullard Speech
https://www.investing.com/economic-calendar/
***New: PTG Trading Room Chat Log’s Link
S&P 500

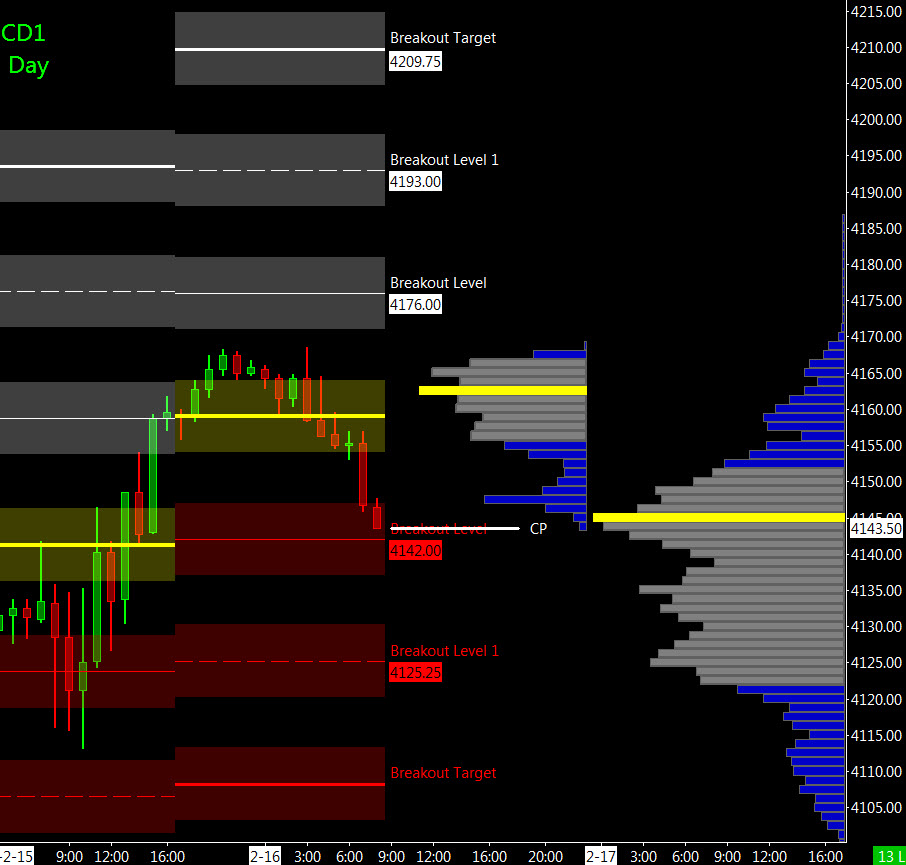
Prior Session was Cycle Day 3 (CD3): Early test of lower support zone outlined in prior DTS Briefing 021523 held firm as buyers responded, absorbing the supply, and shifting momentum to the bull camp, closing on the highs of the day. Prior range was 48 handles on 1.566M contracts exchanged.
…Transition from Cycle Day 3 to Cycle Day 1
This leads us into Cycle Day 1 (CD1): Average Decline measures 4106. Bullish momentum at end of prior session may continue to spill into today’s session, before the next decline develops. Monthly Options Expire on Friday as 4200 is the prominent strike. As such, estimated scenarios to consider for today’s trading.
Bull Scenario: Price sustains a bid above 4155, initially targets 4175 – 4195 zone.
Bear Scenario: Price sustains an offer below 4155, initially targets 4135 – 4130 zone.
PVA High Edge = 4155 PVA Low Edge = 4120 Prior POC = 4133
Range Projections and Key Levels (ES) March 2023 (H) Contract
HOD ATR Range Projection: 4212; LOD ATR Range Projection: 4103; 3 Day Central Pivot: 4138; 3 Day Cycle Target: 4218; 10 Day Average True Range 66; VIX: 18
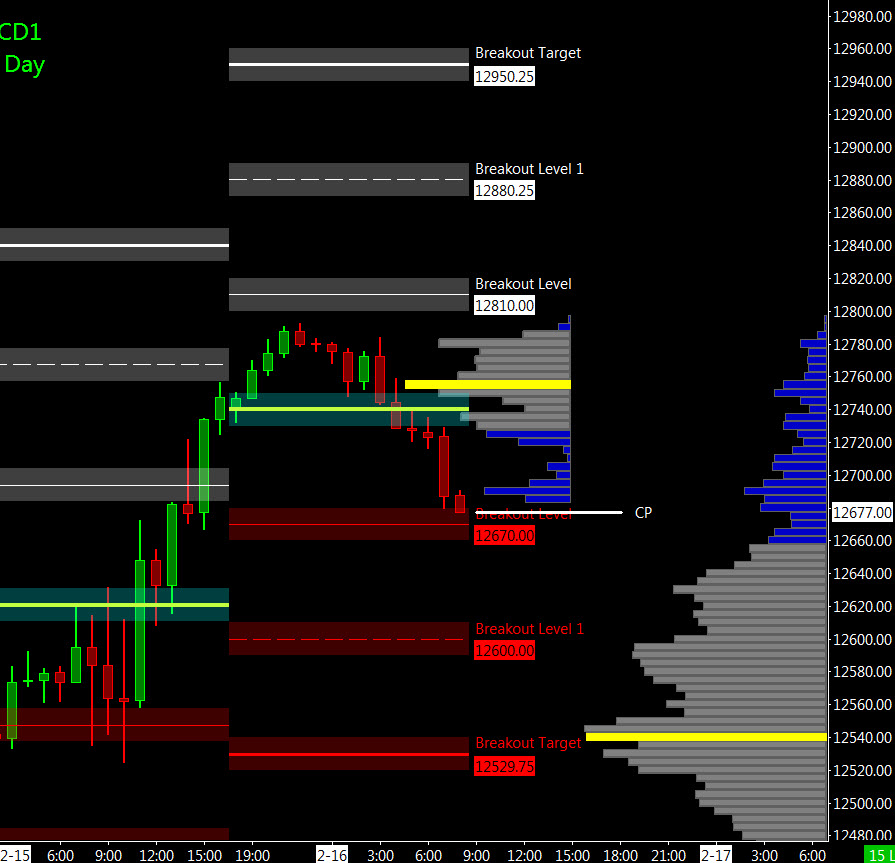
Nasdaq 100 (NQ)

Today is Cycle Day 1 (CD1)…Average Decline measures 12530. Bullish momentum at end of prior session may continue to spill into today’s session, before the next decline develops. As such, estimated scenarios to consider for today’s trading.
Bull Scenario: IF Bulls sustains bid above 12755, THEN initial upside estimate targets 12880– 12890 zone.
Bear Scenario: IF Bears sustains offer below 12755, THEN initial downside estimate targets 12670 – 12660 zone.
PVA High Edge = 12650 PVA Low Edge = 12540 Prior POC = 12572
Range Projections and Key Levels (NQ) March 2023 (H) Contract
HOD ATR Range Projection: 12977; LOD ATR Range Projection: 12494; 3 Day Central Pivot: 12566; 3 Day Cycle Target: 12964; 10 Day Average True Range: 298; VIX: 18
Trade Strategy: Our tactical trade strategy will simply remain unaltered…We’ll be flexible to trade both long and short side from Decision Pivot Levels. Continue to focus on Bull/Bear Stackers and Premium/Discounts. As always, remaining in alignment with dominant intra-day force increases probabilities of producing winning trades.
Stay Focused…Non-Biased…Disciplined ALWAYS USE STOPS!
Good Trading…David
“Knowing is not enough, We must APPLY. Willing is not enough, We must DO.” –Bruce Lee
*****This trade strategy report is disseminated for “education only” and should not be viewed in any way as a recommendation to buy or sell futures products.”
PAST PERFORMANCE IS NOT NECESSARILY INDICATIVE OF FUTURE RESULTS
IMPORTANT NOTICE! No representation is being made that the use of this strategy or any system or trading methodology will generate profits. Past performance is not necessarily indicative of future results. There is substantial risk of loss associated with trading securities and options on equities. Only risk capital should be used to trade. Trading securities is not suitable for everyone.
Disclaimer: Futures, Options, and Currency trading all have large potential rewards, but they also have large potential risk. You must be aware of the risks and be willing to accept them in order to invest in these markets. Don’t trade with money you can’t afford to lose.
This website is neither a solicitation nor an offer to Buy/Sell futures, options, or currencies. No representation is being made that any account will or is likely to achieve profits or losses similar to those discussed on this web site. The past performance of any trading system or methodology is not necessarily indicative of future results.
CFTC RULE 4.41 –HYPOTHETICAL OR SIMULATED PERFORMANCE RESULTS HAVE CERTAIN LIMITATIONS. UNLIKE AN ACTUAL PERFORMANCE RECORD, SIMULATED RESULTS DO NOT REPRESENT ACTUAL TRADING. ALSO, SINCE THE TRADES HAVE NOT BEEN EXECUTED, THE RESULTS MAY HAVE UNDER-OR-OVER COMPENSATED FOR THE IMPACT, IF ANY, OF CERTAIN MARKET FACTORS, SUCH AS LACK OF LIQUIDITY. SIMULATED TRADING PROGRAMS IN GENERAL ARE ALSO SUBJECT TO THE FACT THAT THEY ARE DESIGNED WITH THE BENEFIT OF HINDSIGHT. NO REPRESENTATION IS BEING MADE THAT ANY ACCOUNT WILL OR IS LIKELY TO ACHIEVE PROFIT OR LOSSES SIMILAR TO THOSE SHOWN