
Markets (Top Stories)

Economic Calendar
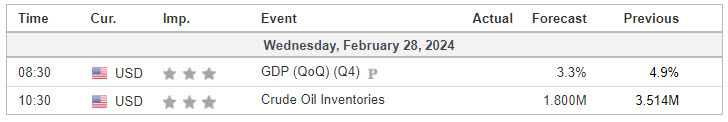
https://www.investing.com/economic-calendar/
S&P 500

***Written for contribution to MrTopStep’s “The Opening Print” publication.
Prior Session was Cycle Day 2 (Sell Day): Normal CD2 as price action was lethargic most of the session, as light but consistent downside pressure tested 5070 – 5065 lower target/reversal zone, as outlined in prior DTS Briefing 2.27.28. Responsive buyers were active and strong enough to reverse price direction, closing right back to 5090 as outlined. Overall, this session was a “textbook” Cycle Day 2 (Sell Day). Prior range was 26 handles on 976k contracts exchanged.
…Transition from Cycle Day 2 to Cycle Day 3
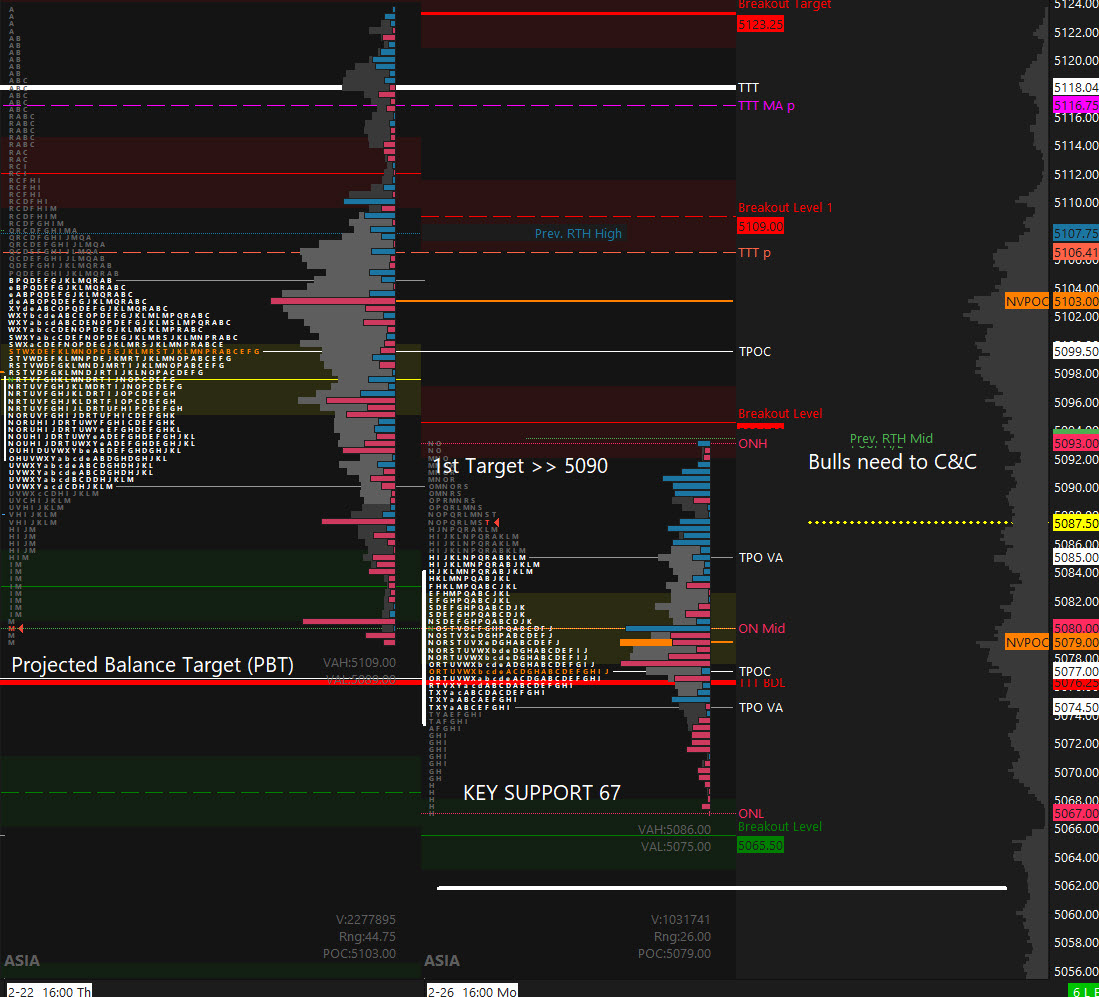
This leads us into Cycle Day 3 (Sell Short Day): Rally from key support low (5065) recovered price back to 5090 Weekly Line in the Sand (LIS). This level marks a DECISION POINT (DP) in PTG’s estimation for control, which still favors bulls, though we will as always follow our daily trade plan. Stay flexible and in-alignment with the primary intra-day forces. As such, scenarios to consider for today’s trading.
Bull Scenario: Price sustains a bid above 5090, initially targets 5105 – 5110 zone.
Bear Scenario: Price sustains an offer below 5090, initially targets 5070 – 5065 zone.
PVA High Edge = 5085 PVA Low Edge = 5075 Prior POC = 5078
PTG 3 Day Cycle
EXCLUSIVE OFFER

*****The 3 Day Cycle has a 90% probability of fulfilling Positive Cycle Statistics covering 12 years of recorded tracking history.
For more detailed information for both bullish and bearish projected targets, please visit: PTG 3 Day Cycle and/or reference the Cycle Spreadsheet below:
Link to access full Cycle Spreadsheet > > Cycle Day 3 (CD3)
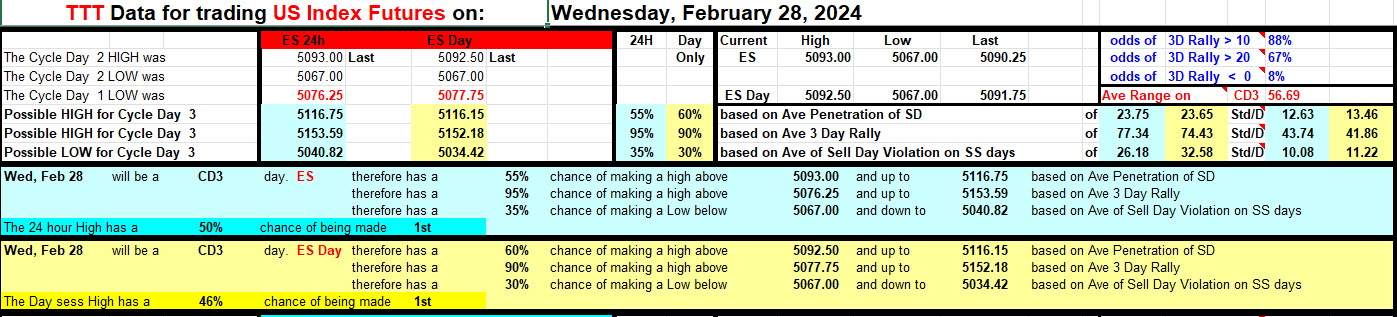
Range Projections (ES) March 2024 (H)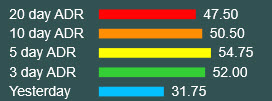
Nasdaq 100 (NQ)

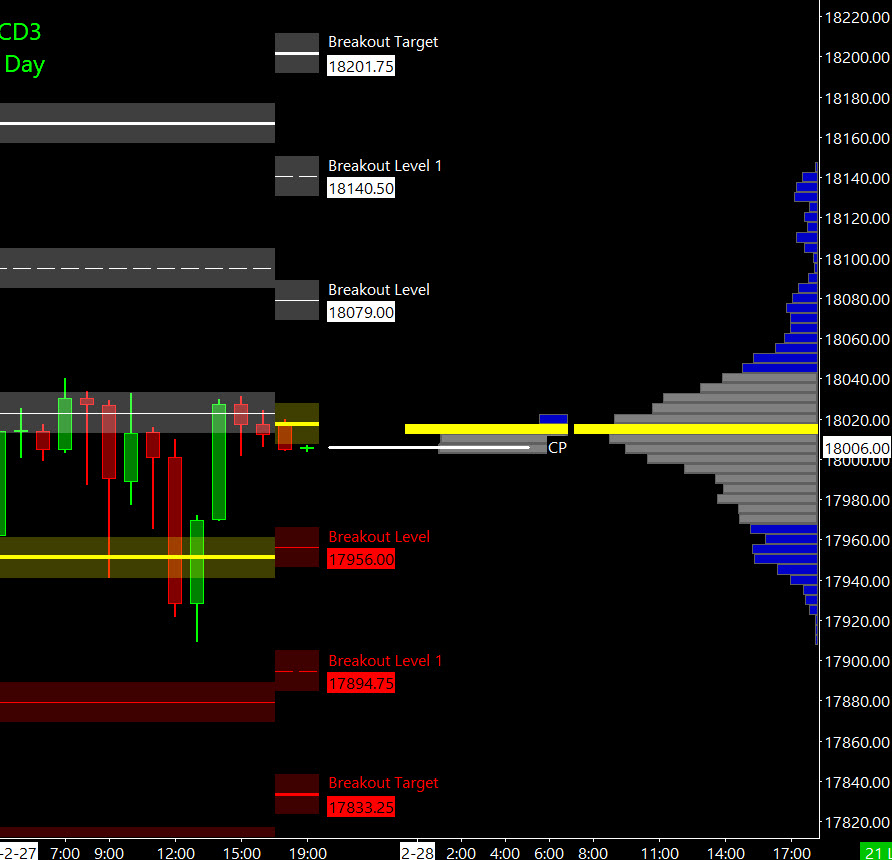
Prior Session was Cycle Day 2 (Sell Day): Normal CD2 as price action was lethargic most of the session, as the Line in the Sand (LIS) 17920 held firm as outlined in prior DTS Briefing 2.27.28. Responsive buyers were active and strong enough to reverse price direction, closing right back to 5-day Point of Control (POC). Overall, this session was a “textbook” Cycle Day 2 (Sell Day). Prior range was 131 handles on 562k contracts exchanged.
…Transition from Cycle Day 2 to Cycle Day 3
This leads us into Cycle Day 3 (Sell Short Day): The 5-day Line in the Sand (LIS) marks a DECISION POINT (DP) in PTG’s estimation for control, which still favors bulls. Clear and Convert (CnC) above 18085 is the bulls objective. Whereas, breakdown below 17922 is the Bears task. Stay flexible and in-alignment with the primary intra-day forces. As such, scenarios to consider for today’s trading.
Bull Scenario: Price sustains a bid above 18015, initially targets 18065 – 18085 zone.
Bear Scenario: Price sustains an offer below 18015, initially targets 17925 – 17855 zone.
PVA High Edge = 18025 PVA Low Edge = 17972 Prior POC = 18015
Range Projections (NQ) March 2024 (H)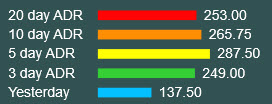

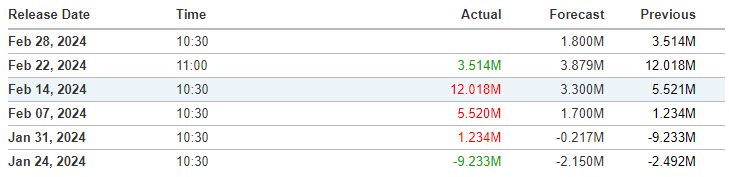
U.S. crude inventories rose by about 8.4 million barrels for the week ended Feb. 25, compared with a build of 7.2M barrels reported by the API for the previous week. Economists were expecting an increase of about 1.5M barrels.
The API data also showed that gasoline inventories fell by about 3.3M barrels, and distillate stockpiles fell by 523,000 barrels, compared with expectations for a draw of about 1.3M barrels and 2M barrels, respectively. The ongoing draw in product stockpiles has been spurred low domestic refinery activity amid maintenance and weather-related constraints.
The official government inventory report due Thursday is expected to show weekly U.S. crude supplies increased by about 1.8M barrels last week.
 Source: investing.com
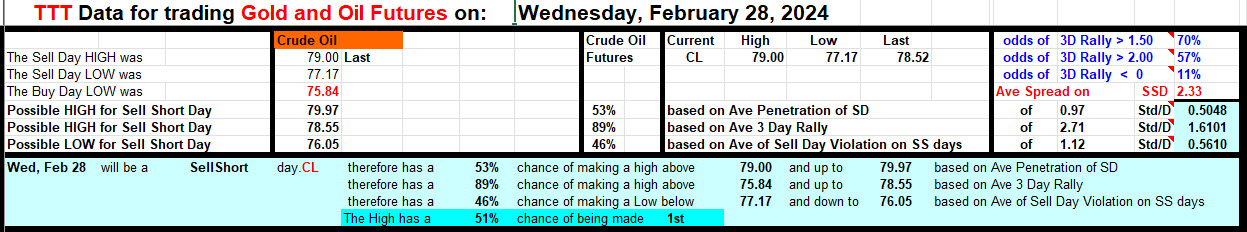
Trade Strategy: Our tactical trade strategy will simply remain unaltered…We’ll be flexible to trade both long and short side from Decision Pivot Levels. Continue to focus on Bull/Bear Stackers and Premium/Discounts. As always, remaining in alignment with dominant intra-day force increases probabilities of producing winning trades.
Stay Focused…Non-Biased…Disciplined ALWAYS USE STOPS!
Good Trading…David
“Knowing is not enough, We must APPLY. Willing is not enough, We must DO.” –Bruce Lee
*****This trade strategy report is disseminated for “education only” and should not be viewed in any way as a recommendation to buy or sell futures products.”
PAST PERFORMANCE IS NOT NECESSARILY INDICATIVE OF FUTURE RESULTS
IMPORTANT NOTICE! No representation is being made that the use of this strategy or any system or trading methodology will generate profits. Past performance is not necessarily indicative of future results. There is substantial risk of loss associated with trading securities and options on equities. Only risk capital should be used to trade. Trading securities is not suitable for everyone.
Disclaimer: Futures, Options, and Currency trading all have large potential rewards, but they also have large potential risk. You must be aware of the risks and be willing to accept them in order to invest in these markets. Don’t trade with money you can’t afford to lose.
This website is neither a solicitation nor an offer to Buy/Sell futures, options, or currencies. No representation is being made that any account will or is likely to achieve profits or losses similar to those discussed on this web site. The past performance of any trading system or methodology is not necessarily indicative of future results.
CFTC RULE 4.41 –HYPOTHETICAL OR SIMULATED PERFORMANCE RESULTS HAVE CERTAIN LIMITATIONS. UNLIKE AN ACTUAL PERFORMANCE RECORD, SIMULATED RESULTS DO NOT REPRESENT ACTUAL TRADING. ALSO, SINCE THE TRADES HAVE NOT BEEN EXECUTED, THE RESULTS MAY HAVE UNDER-OR-OVER COMPENSATED FOR THE IMPACT, IF ANY, OF CERTAIN MARKET FACTORS, SUCH AS LACK OF LIQUIDITY. SIMULATED TRADING PROGRAMS IN GENERAL ARE ALSO SUBJECT TO THE FACT THAT THEY ARE DESIGNED WITH THE BENEFIT OF HINDSIGHT. NO REPRESENTATION IS BEING MADE THAT ANY ACCOUNT WILL OR IS LIKELY TO ACHIEVE PROFIT OR LOSSES SIMILAR TO THOSE SHOWN