
Markets (Top Stories)

What is the Personal Consumption Expenditures Price Index?
A measure of the prices that people living in the United States, or those buying on their behalf, pay for goods and services. The PCE price index is known for capturing inflation (or deflation) across a wide range of consumer expenses and reflecting changes in consumer behavior.
Source: bea.gov
Economic Calendar
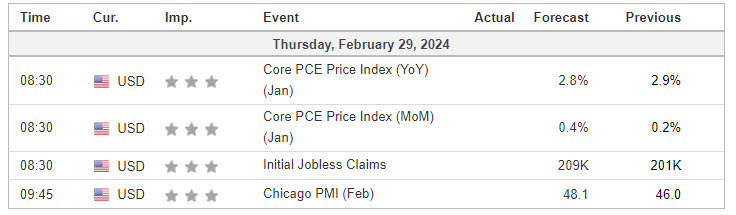
https://www.investing.com/economic-calendar/
S&P 500

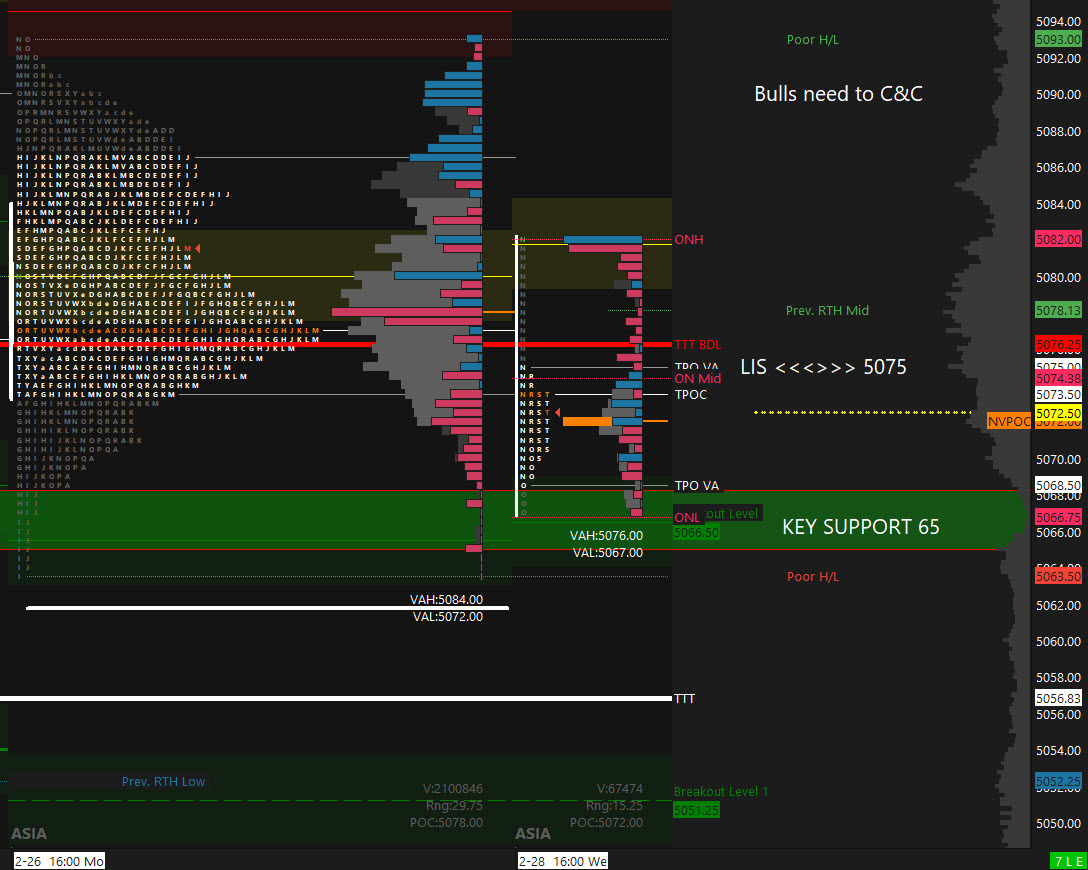
Prior Session was Cycle Day 3 (Sell Short Day): Positive 3 Day Cycle with price trading above 5076 Cycle Day 1 (Buy Day) Low. Another balancing day as price continues to contract, setting up for the next expansionary phase. Prior range was 28 handles on 1.134M contracts exchanged.
…Transition from Cycle Day 3 to Cycle Day 1
This leads us into Cycle Day 1 (Buy Day): Average Decline for CD1 measures 5056. Key event for today is the PCE Index, which is an important inflation metric, that has the potential in generating a market-moving event. Given the recent price contraction, Mr. Market will be looking for a catalytic breakout.
Our daily plan remains unchanged. Stay flexible and in-alignment with the primary intra-day forces. As such, scenarios to consider for today’s trading.
Bull Scenario: Price sustains a bid above 5075, initially targets 5085 – 5090 zone.
Bear Scenario: Price sustains an offer below 5075, initially targets 5060 – 5055 zone.
PVA High Edge = 5182 PVA Low Edge = 5071 Prior POC = 5075
PTG 3 Day Cycle
EXCLUSIVE OFFER

*****The 3 Day Cycle has a 90% probability of fulfilling Positive Cycle Statistics covering 12 years of recorded tracking history.
Range Projections (ES) March 2024 (H)
Nasdaq 100 (NQ)

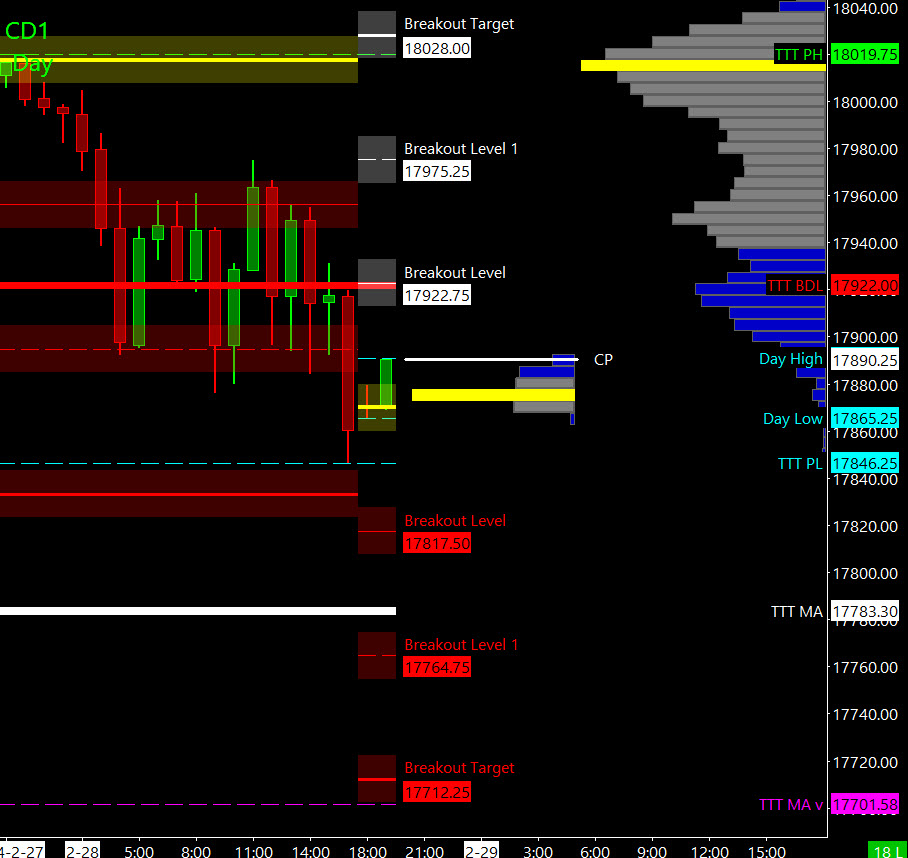
Prior Session was Cycle Day 3 (Sell Short Day): Positive 3 Day Cycle with price trading above 17922 Cycle Day 1 (Buy Day) Low. Another balancing day as price continues to contract, setting up for the next expansionary phase. Prior range was 173 handles on 546k contracts exchanged.
…Transition from Cycle Day 3 to Cycle Day 1
This leads us into Cycle Day 1 (Buy Day): Average Decline for CD1 measures 17783. Key event for today is the PCE Index, which is an important inflation metric, that has the potential in generating a market-moving event. Given the recent price contraction, Mr. Market will be looking for a catalytic breakout.
Our daily plan remains unchanged. Stay flexible and in-alignment with the primary intra-day forces. As such, scenarios to consider for today’s trading.
Bull Scenario: Price sustains a bid above 17850, initially targets 17950 – 17975 zone.
Bear Scenario: Price sustains an offer below 17850, initially targets 17785 – 17765 zone.
PVA High Edge = 17950 PVA Low Edge = 17898 Prior POC = 17916
Range Projections (NQ) March 2024 (H)
Trade Strategy: Our tactical trade strategy will simply remain unaltered…We’ll be flexible to trade both long and short side from Decision Pivot Levels. Continue to focus on Bull/Bear Stackers and Premium/Discounts. As always, remaining in alignment with dominant intra-day force increases probabilities of producing winning trades.
Stay Focused…Non-Biased…Disciplined ALWAYS USE STOPS!
Good Trading…David
“Knowing is not enough, We must APPLY. Willing is not enough, We must DO.” –Bruce Lee
*****This trade strategy report is disseminated for “education only” and should not be viewed in any way as a recommendation to buy or sell futures products.”
PAST PERFORMANCE IS NOT NECESSARILY INDICATIVE OF FUTURE RESULTS
IMPORTANT NOTICE! No representation is being made that the use of this strategy or any system or trading methodology will generate profits. Past performance is not necessarily indicative of future results. There is substantial risk of loss associated with trading securities and options on equities. Only risk capital should be used to trade. Trading securities is not suitable for everyone.
Disclaimer: Futures, Options, and Currency trading all have large potential rewards, but they also have large potential risk. You must be aware of the risks and be willing to accept them in order to invest in these markets. Don’t trade with money you can’t afford to lose.
This website is neither a solicitation nor an offer to Buy/Sell futures, options, or currencies. No representation is being made that any account will or is likely to achieve profits or losses similar to those discussed on this web site. The past performance of any trading system or methodology is not necessarily indicative of future results.
CFTC RULE 4.41 –HYPOTHETICAL OR SIMULATED PERFORMANCE RESULTS HAVE CERTAIN LIMITATIONS. UNLIKE AN ACTUAL PERFORMANCE RECORD, SIMULATED RESULTS DO NOT REPRESENT ACTUAL TRADING. ALSO, SINCE THE TRADES HAVE NOT BEEN EXECUTED, THE RESULTS MAY HAVE UNDER-OR-OVER COMPENSATED FOR THE IMPACT, IF ANY, OF CERTAIN MARKET FACTORS, SUCH AS LACK OF LIQUIDITY. SIMULATED TRADING PROGRAMS IN GENERAL ARE ALSO SUBJECT TO THE FACT THAT THEY ARE DESIGNED WITH THE BENEFIT OF HINDSIGHT. NO REPRESENTATION IS BEING MADE THAT ANY ACCOUNT WILL OR IS LIKELY TO ACHIEVE PROFIT OR LOSSES SIMILAR TO THOSE SHOWN