
Markets (Top Stories)

Economic Calendar
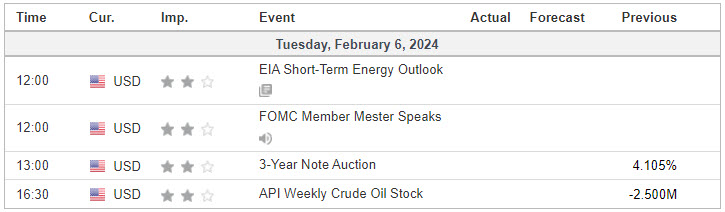
https://www.investing.com/economic-calendar/
S&P 500

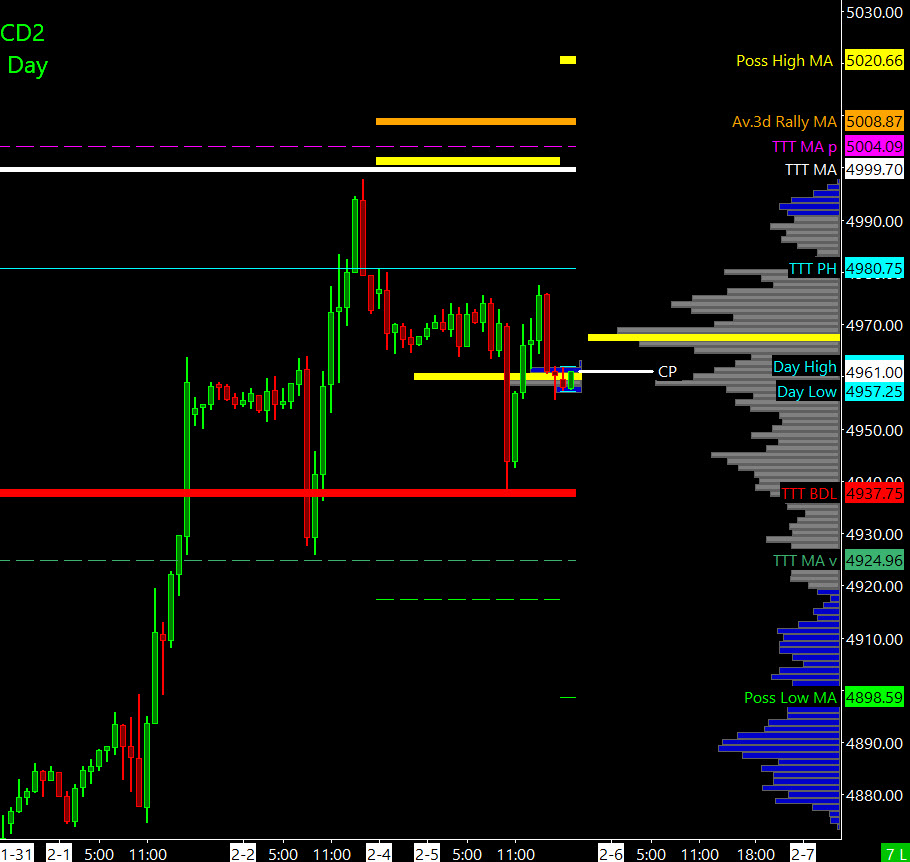
Prior Session was Cycle Day 1 (CD1): Price established a new Cycle Low at 4937.75, as price continued to consolidated within reach of the BIG 5000 Level. Prior range was 43 handles on 1.407M contracts exchanged.
…Transition from Cycle Day 1 to Cycle Day 2
This leads us into Cycle Day 2 (CD2): Bulls need to Clear and Convert (C&C) the 4975 level as Bears need to force liquidation below 4950 Level. We’ll be looking for Mr. Market to break the current “log-jam” and decide on a directional lean. As always, stay flexible and in-alignment with the primary intra-day forces. As such, scenarios to consider for today’s trading.
Bull Scenario: Price sustains a bid above 4975, initially targets 4995 – 5005 zone.
Bear Scenario: Price sustains an offer below 4950, initially targets 4930 – 4925 zone.
PVA High Edge = 4975 PVA Low Edge = 4957 Prior POC = 4967
Range Projections and Key Levels (ES) March 2024 (H) Contract
HOD ATR Range Projection: 5008; LOD ATR Range Projection: 4910; 3 Day Central Pivot: 4950; 3 Day Cycle Target: 5008; 10 Day Average True Range 51; VIX: 13
Nasdaq 100 (NQ)

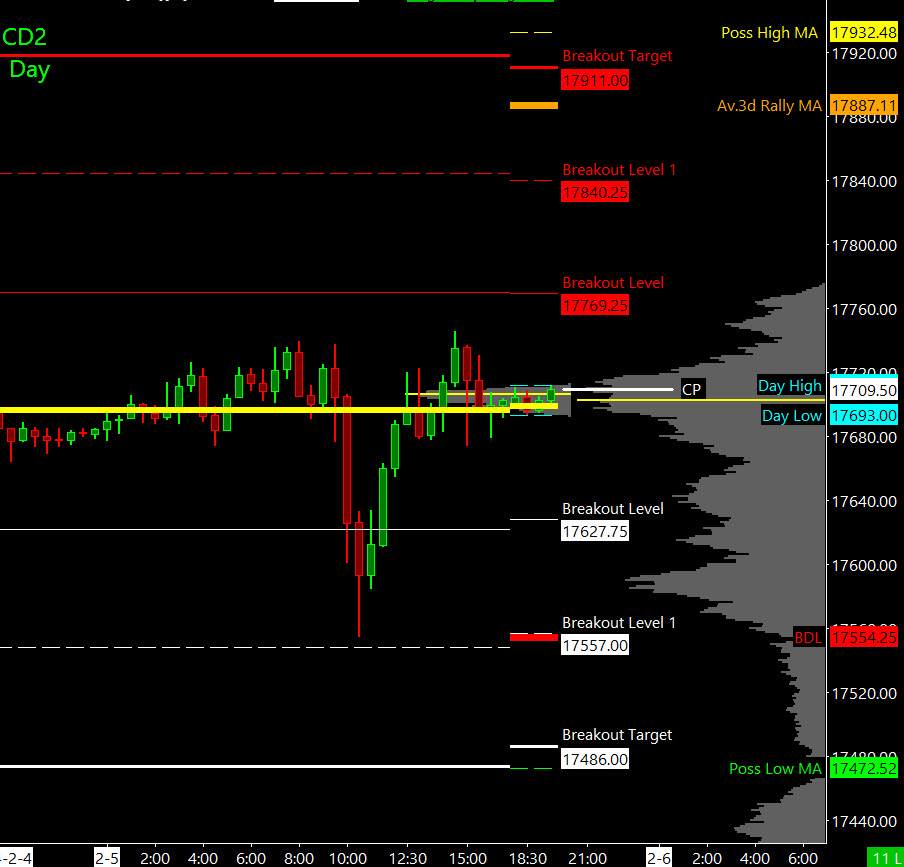
Prior Session was Cycle Day 1 (CD1): Price established a new Cycle Low at 17554, as normal Cycle Day 1 unfolded within a wide consolidation range. Prior range was 191 handles on 614k contracts exchanged.
…Transition from Cycle Day 1 to Cycle Day 2
This leads us into Cycle Day 2 (CD2): Bulls need to Clear and Convert (C&C) the 17745 level as Bears need to force liquidation below 17555 Level. We’ll be looking for Mr. Market to break the current “log-jam” and decide on a directional lean. As always, stay flexible and in-alignment with the primary intra-day forces. As such, scenarios to consider for today’s trading.
Bull Scenario: Price sustains a bid above 17700, initially targets 17770 – 17840 zone.
Bear Scenario: Price sustains an offer below 17700, initially targets 17600 – 17585 zone.
PVA High Edge = 17736 PVA Low Edge = 17674 Prior POC = 17701
Range Projections and Key Levels (NQ) March 2024 (H) Contract
HOD ATR Range Projection: 17954; LOD ATR Range Projection: 17450; 3 Day Central Pivot: 17607; 3 Day Cycle Target: 17887; 10 Day Average True Range: 261 VIX: 13
Trade Strategy: Our tactical trade strategy will simply remain unaltered…We’ll be flexible to trade both long and short side from Decision Pivot Levels. Continue to focus on Bull/Bear Stackers and Premium/Discounts. As always, remaining in alignment with dominant intra-day force increases probabilities of producing winning trades.
Stay Focused…Non-Biased…Disciplined ALWAYS USE STOPS!
Good Trading…David
“Knowing is not enough, We must APPLY. Willing is not enough, We must DO.” –Bruce Lee
*****This trade strategy report is disseminated for “education only” and should not be viewed in any way as a recommendation to buy or sell futures products.”
PAST PERFORMANCE IS NOT NECESSARILY INDICATIVE OF FUTURE RESULTS
IMPORTANT NOTICE! No representation is being made that the use of this strategy or any system or trading methodology will generate profits. Past performance is not necessarily indicative of future results. There is substantial risk of loss associated with trading securities and options on equities. Only risk capital should be used to trade. Trading securities is not suitable for everyone.
Disclaimer: Futures, Options, and Currency trading all have large potential rewards, but they also have large potential risk. You must be aware of the risks and be willing to accept them in order to invest in these markets. Don’t trade with money you can’t afford to lose.
This website is neither a solicitation nor an offer to Buy/Sell futures, options, or currencies. No representation is being made that any account will or is likely to achieve profits or losses similar to those discussed on this web site. The past performance of any trading system or methodology is not necessarily indicative of future results.
CFTC RULE 4.41 –HYPOTHETICAL OR SIMULATED PERFORMANCE RESULTS HAVE CERTAIN LIMITATIONS. UNLIKE AN ACTUAL PERFORMANCE RECORD, SIMULATED RESULTS DO NOT REPRESENT ACTUAL TRADING. ALSO, SINCE THE TRADES HAVE NOT BEEN EXECUTED, THE RESULTS MAY HAVE UNDER-OR-OVER COMPENSATED FOR THE IMPACT, IF ANY, OF CERTAIN MARKET FACTORS, SUCH AS LACK OF LIQUIDITY. SIMULATED TRADING PROGRAMS IN GENERAL ARE ALSO SUBJECT TO THE FACT THAT THEY ARE DESIGNED WITH THE BENEFIT OF HINDSIGHT. NO REPRESENTATION IS BEING MADE THAT ANY ACCOUNT WILL OR IS LIKELY TO ACHIEVE PROFIT OR LOSSES SIMILAR TO THOSE SHOWN