
Markets (Top Stories)

Source: SeekingAlpha.com
Economic Calendar
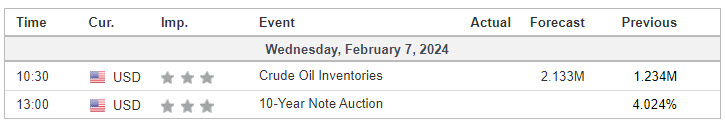
https://www.investing.com/economic-calendar/

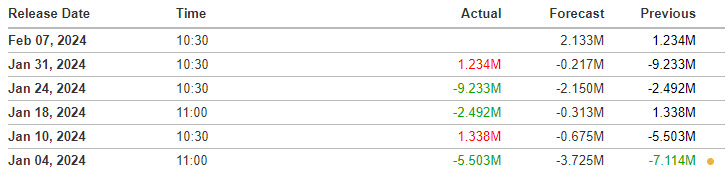
U.S. crude inventories rose by about 674,000 barrels for the week ended Feb. 2, compared with a draw of about 2.5M barrels reported by the API for the previous week. Economists were expecting an increase of about 2.1M barrels.
U.S. production has been recovering following a weather-related dip in January, but will likely slow from record levels in 2024, the Energy Information Agency said Tuesday as it cut its forecast for domestic oil output by 120,000 barrels per day to 170,000 bpd.
The API data also showed that both gasoline inventories rose by about 3.7M, but distillate stockpiles fell by 3.7M barrels.
The official government inventory report due Wednesday is expected to show weekly U.S. crude supplies decreased by about 2.1M barrels last week.
 Source: Investing.com
S&P 500

***Written for contribution to MrTopStep’s “The Opening Print” publication.
Prior Session was Cycle Day 2 (CD2): Normal Cycle Day 2 as price continued it’s consolidation between 4950 – 4975 as outlined in prior DTS Briefing 2/6/24. Prior range was 24 handles on 1.217M contracts exchanged.
…Transition from Cycle Day 2 to Cycle Day 3
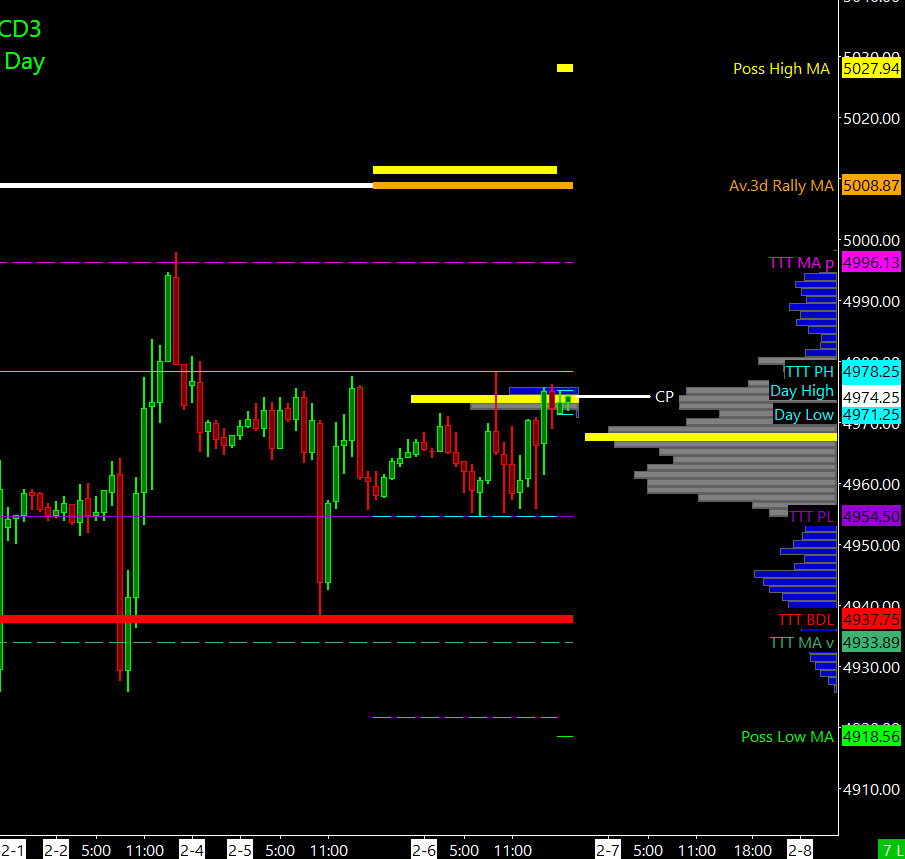
This leads us into Cycle Day 3 (CD3): Markets transition from Expansion (trend) to Contraction (range) and back to Expansion (trend). Price is currently in the “contraction-stage” and is building energy for the next directional expansion. KEY Target for the current Cycle measures 5008. IF price can Clear and Convert the 4975 – 4980 zone, THEN this sets this cycle objective “in-play.”
We are not in the game of predictions, but probabilities. Markets initially rejected the first attempt at the 5000 level, but the pullback has been more absorption of the sellers. In other words, long sellers have exited positions and shorts sellers (open positions) risk being squeezed out on a breakout above noted levels.
As always, PTG’s daily plan remains unchanged. Stay flexible and in-alignment with the primary intra-day forces. As such, scenarios to consider for today’s trading.
Bull Scenario: Price sustains a bid above 4975, initially targets 4995 – 5010 zone.
Bear Scenario: Price sustains an offer below 4975, initially targets 4950 – 4940 zone.
PVA High Edge = 4968 PVA Low Edge = 4958 Prior POC = 4962
*****The 3 Day Cycle has a 90% probability of fulfilling Positive Cycle Statistics covering 12 years of recorded tracking history.
For more detailed information for both bullish and bearish projected targets, please visit: PTG 3 Day Cycle and/or reference the Cycle Spreadsheet below:
Link to access full Cycle Spreadsheet > > Cycle Day 3 (CD3)
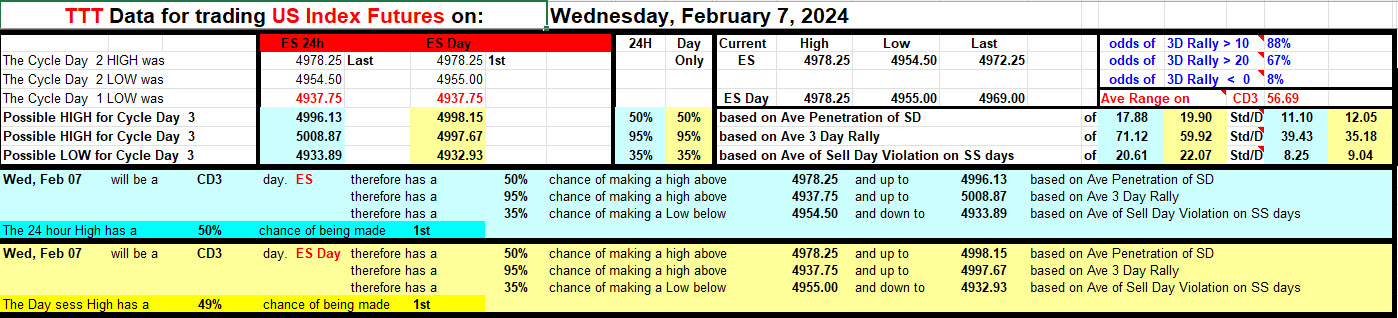
Range Projections and Key Levels (ES) March 2024 (H) Contract
HOD ATR Range Projection: 5022; LOD ATR Range Projection: 4924; 3 Day Central Pivot: 4962; 3 Day Cycle Target: 5008; 10 Day Average True Range 50; VIX: 13
Nasdaq 100 (NQ)

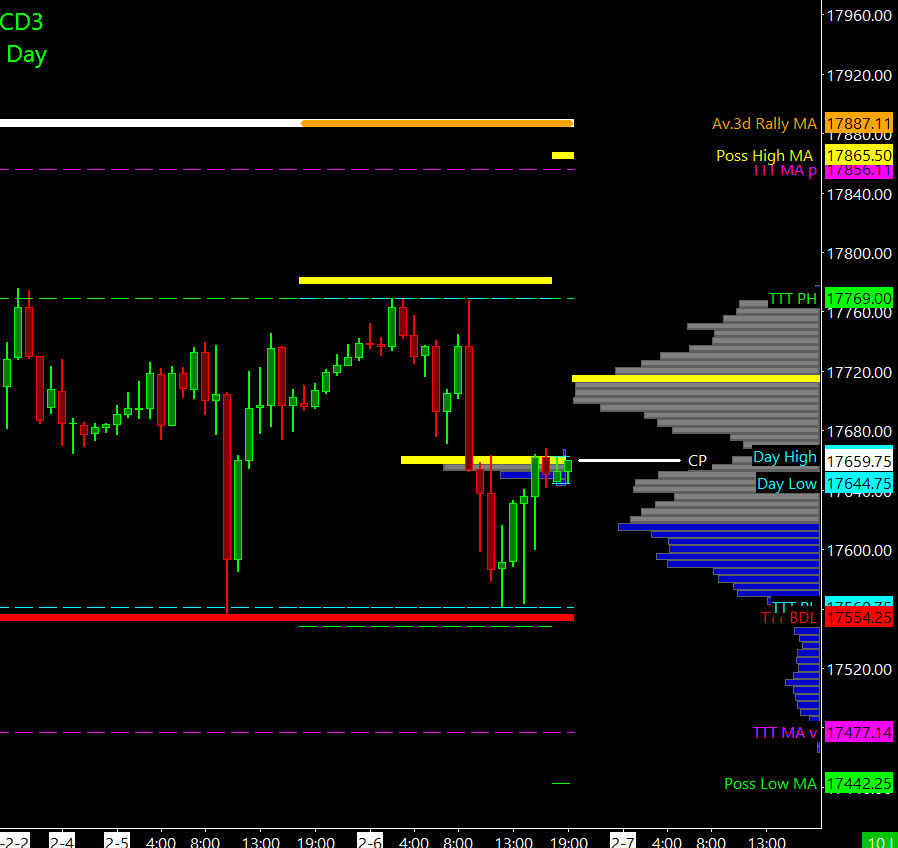
Prior Session was Cycle Day 2 (CD2): Normal Cycle Day 2 unfolded for the NQ as price did reach initial upper target (17770) and was immediately rejected. Subsequent attempt not only was rejected, but a hard reversal unfolded, pushing price down to test PL (17560), where buyers stepped-in. At the final bell, wide-range day with no directional advancement by either the bulls or bears. Prior range was 208 handles on 617k contracts exchanged.
…Transition from Cycle Day 2 to Cycle Day 3
This leads us into Cycle Day 3 (CD3): As long as price trades above CD1 Low (17554) during RTH Session, anything goes for direction. Overall consolidation does suggest bulls absorbing supply, which may set the setup for an upwards “thrust-day”. KEY level to Clear and Convert is 17770 with Cycle Target measuring 17887. As such, scenarios to consider for today’s trading.
Bull Scenario: Price sustains a bid above 17670, initially targets 17770 – 17780 zone.
Bear Scenario: Price sustains an offer below 17670, initially targets 17580 – 17560 zone.
PVA High Edge = 17663 PVA Low Edge = 17568 Prior POC = 17638
Range Projections and Key Levels (NQ) March 2024 (H) Contract
HOD ATR Range Projection: 17912; LOD ATR Range Projection: 17395; 3 Day Central Pivot: 17675; 3 Day Cycle Target: 17887; 10 Day Average True Range: 267; VIX: 13
Trade Strategy: Our tactical trade strategy will simply remain unaltered…We’ll be flexible to trade both long and short side from Decision Pivot Levels. Continue to focus on Bull/Bear Stackers and Premium/Discounts. As always, remaining in alignment with dominant intra-day force increases probabilities of producing winning trades.
Stay Focused…Non-Biased…Disciplined ALWAYS USE STOPS!
Good Trading…David
“Knowing is not enough, We must APPLY. Willing is not enough, We must DO.” –Bruce Lee
*****This trade strategy report is disseminated for “education only” and should not be viewed in any way as a recommendation to buy or sell futures products.”
PAST PERFORMANCE IS NOT NECESSARILY INDICATIVE OF FUTURE RESULTS
IMPORTANT NOTICE! No representation is being made that the use of this strategy or any system or trading methodology will generate profits. Past performance is not necessarily indicative of future results. There is substantial risk of loss associated with trading securities and options on equities. Only risk capital should be used to trade. Trading securities is not suitable for everyone.
Disclaimer: Futures, Options, and Currency trading all have large potential rewards, but they also have large potential risk. You must be aware of the risks and be willing to accept them in order to invest in these markets. Don’t trade with money you can’t afford to lose.
This website is neither a solicitation nor an offer to Buy/Sell futures, options, or currencies. No representation is being made that any account will or is likely to achieve profits or losses similar to those discussed on this web site. The past performance of any trading system or methodology is not necessarily indicative of future results.
CFTC RULE 4.41 –HYPOTHETICAL OR SIMULATED PERFORMANCE RESULTS HAVE CERTAIN LIMITATIONS. UNLIKE AN ACTUAL PERFORMANCE RECORD, SIMULATED RESULTS DO NOT REPRESENT ACTUAL TRADING. ALSO, SINCE THE TRADES HAVE NOT BEEN EXECUTED, THE RESULTS MAY HAVE UNDER-OR-OVER COMPENSATED FOR THE IMPACT, IF ANY, OF CERTAIN MARKET FACTORS, SUCH AS LACK OF LIQUIDITY. SIMULATED TRADING PROGRAMS IN GENERAL ARE ALSO SUBJECT TO THE FACT THAT THEY ARE DESIGNED WITH THE BENEFIT OF HINDSIGHT. NO REPRESENTATION IS BEING MADE THAT ANY ACCOUNT WILL OR IS LIKELY TO ACHIEVE PROFIT OR LOSSES SIMILAR TO THOSE SHOWN