
Markets (Top Stories)

Economic Calendar
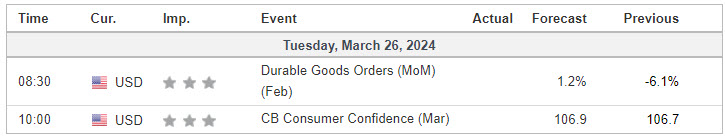
https://www.investing.com/economic-calendar/
S&P 500

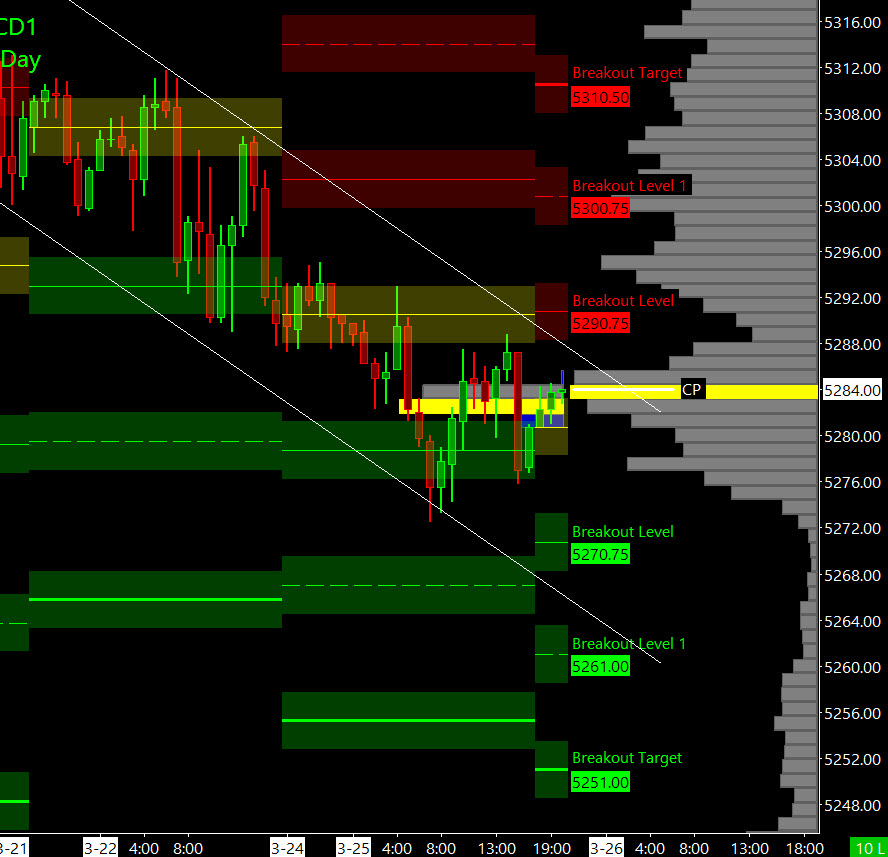
Prior Session was Cycle Day 3: Three-Day Cycle Statistic was fulfilled today as price traded above prior CD1 Low (5293.50) albeit barely. Buyers were not active today as price drifted lower to PTG’s lower target (5275) as outlined in prior DTS 3.25.24. So with two back-to-back negative sessions, today should be telling for either a deeper corrective phase or resurgence of “dip-buyers.” Keep in mind the 2-day pullback is on relatively light volume, which typically is bullish. Range was 22 handles on 853k contracts exchanged.
…Transition from Cycle Day 3 to Cycle Day 1
This leads us into Cycle Day 1: Cycle Day 1 Average Decline measures 5260. Anticipation for this session is support hold of 5270 – 5275 zone with a reclaim of 5295 to break the 2-day down channel. Successful recovery targets 5310 – 5315 zone. We’ll mark 5275 as today’s Line in the Sand (LIS)
As always, our tactical trade plan remains unchanged…Stay in alignment with dominant intra-day forces.
Scenarios to consider for today’s trading.
Bull Scenario: Price sustains a bid above 5275, initially targets 5310 – 5315 zone.
Bear Scenario: Price sustains an offer below 5275, initially targets 5260 – 5255 zone.
PVA High Edge = 5286 PVA Low Edge = 5266 Prior POC = 5284
PTG 3 Day Cycle
EXCLUSIVE OFFER

*****The 3 Day Cycle has a 90% probability of fulfilling Positive Cycle Statistics covering 12 years of recorded tracking history.
Range Projections (ES) June 2024 (M)
- BULL ATR Range Projection >>> 5330
- BEAR ATR Range Projection >>> 5234
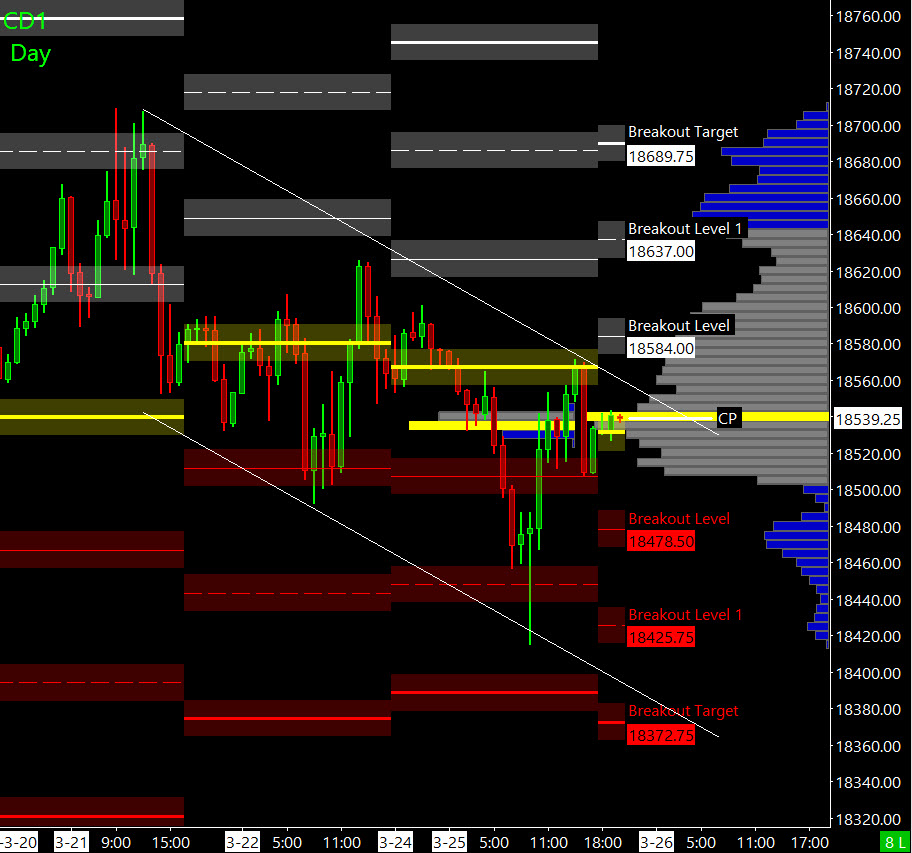
Nasdaq 100 (NQ)

Prior Session was Cycle Day 3: Three-Day Cycle Statistic was fulfilled today as price traded above prior CD1 Low (18526.75). Buyers were not active today as price drifted lower to PTG’s lower target (18420) as outlined in prior DTS 3.25.24. So with two back-to-back negative sessions, today should be telling for either a deeper corrective phase or resurgence of “dip-buyers.” Range was 186 handles on 452k contracts exchanged.
…Transition from Cycle Day 3 to Cycle Day 1
This leads us into Cycle Day 1: Cycle Day 1 Average Decline measures 18330. Anticipation for this session is support hold of 18500 with a reclaim of 18600 to break the 2-day down channel. Successful recovery targets 18640 – 18685 zone. We’ll mark 18500 as today’s Line in the Sand (LIS)
As always, our tactical trade plan remains unchanged…Stay in alignment with dominant intra-day forces.
Scenarios to consider for today’s trading.
Bull Scenario: Price sustains a bid above 18500, initially targets 18575 – 18600 zone.
Bear Scenario: Price sustains an offer below 18500, initially targets 18455 – 18440 zone.
PVA High Edge = 18571 PVA Low Edge = 18503 Prior POC = 18526
Range Projections (NQ) June 2024 (m)
- BULL ATR Range Projection >>> 18781
- BEAR ATR Range Projection >>> 18288
Trade Strategy: Our tactical trade strategy will simply remain unaltered…We’ll be flexible to trade both long and short side from Decision Pivot Levels. Continue to focus on Bull/Bear Stackers and Premium/Discounts. As always, remaining in alignment with dominant intra-day force increases probabilities of producing winning trades.
Stay Focused…Non-Biased…Disciplined ALWAYS USE STOPS!
Good Trading…David
“Knowing is not enough, We must APPLY. Willing is not enough, We must DO.” –Bruce Lee
*****This trade strategy report is disseminated for “education only” and should not be viewed in any way as a recommendation to buy or sell futures products.”
PAST PERFORMANCE IS NOT NECESSARILY INDICATIVE OF FUTURE RESULTS
IMPORTANT NOTICE! No representation is being made that the use of this strategy or any system or trading methodology will generate profits. Past performance is not necessarily indicative of future results. There is substantial risk of loss associated with trading securities and options on equities. Only risk capital should be used to trade. Trading securities is not suitable for everyone.
Disclaimer: Futures, Options, and Currency trading all have large potential rewards, but they also have large potential risk. You must be aware of the risks and be willing to accept them in order to invest in these markets. Don’t trade with money you can’t afford to lose.
This website is neither a solicitation nor an offer to Buy/Sell futures, options, or currencies. No representation is being made that any account will or is likely to achieve profits or losses similar to those discussed on this web site. The past performance of any trading system or methodology is not necessarily indicative of future results.
CFTC RULE 4.41 –HYPOTHETICAL OR SIMULATED PERFORMANCE RESULTS HAVE CERTAIN LIMITATIONS. UNLIKE AN ACTUAL PERFORMANCE RECORD, SIMULATED RESULTS DO NOT REPRESENT ACTUAL TRADING. ALSO, SINCE THE TRADES HAVE NOT BEEN EXECUTED, THE RESULTS MAY HAVE UNDER-OR-OVER COMPENSATED FOR THE IMPACT, IF ANY, OF CERTAIN MARKET FACTORS, SUCH AS LACK OF LIQUIDITY. SIMULATED TRADING PROGRAMS IN GENERAL ARE ALSO SUBJECT TO THE FACT THAT THEY ARE DESIGNED WITH THE BENEFIT OF HINDSIGHT. NO REPRESENTATION IS BEING MADE THAT ANY ACCOUNT WILL OR IS LIKELY TO ACHIEVE PROFIT OR LOSSES SIMILAR TO THOSE SHOWN