
Markets (Top Stories)

Source: investing.com
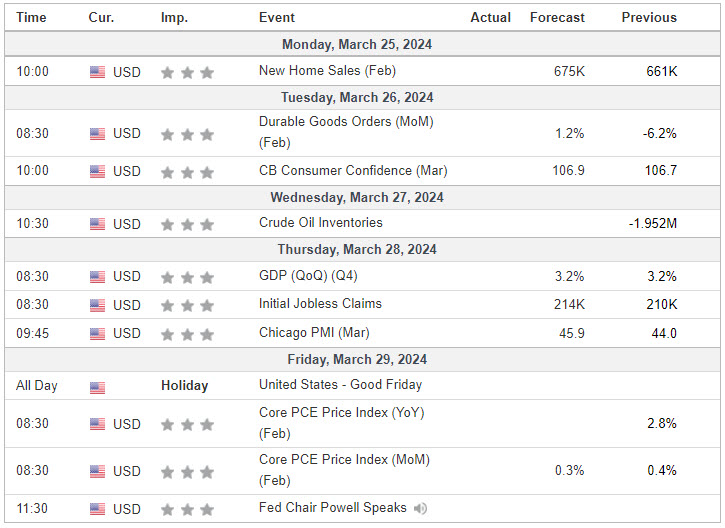
Economic Calendar
S&P 500

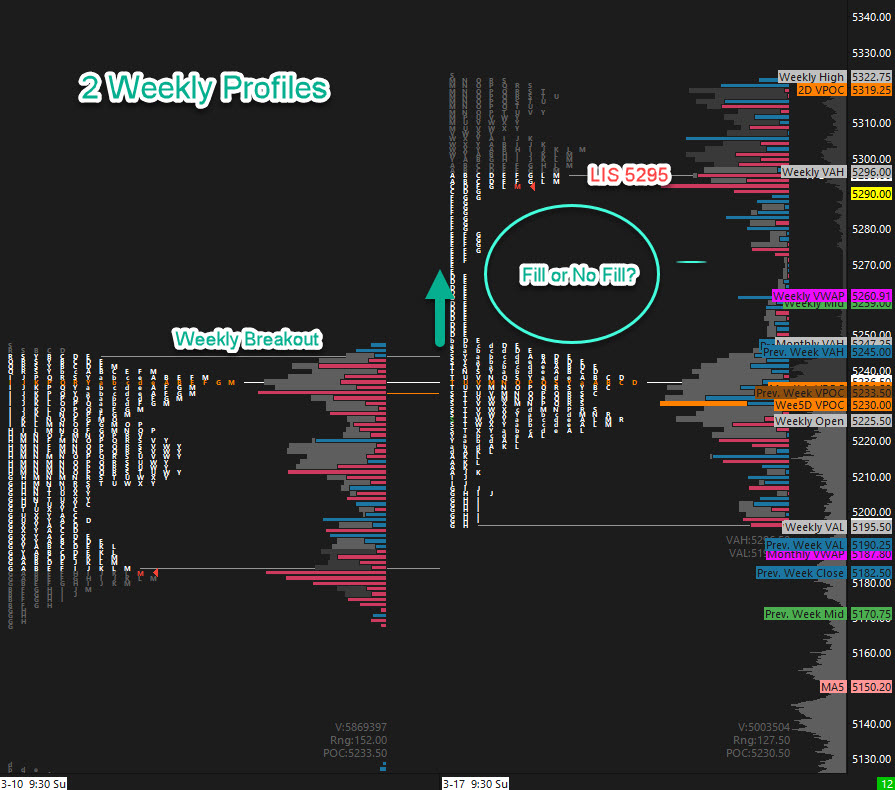
Prior Session was Cycle Day 2: Normal CD2 as price oscillated within well-defined RTH range, testing the upper boundary 5300 – 5305 zone as well as testing gap fill breakout level 5290 – 5295 zone. Range was 24 handles on 1.043M contracts exchanged.
…Transition from Cycle Day 2 to Cycle Day 3
This leads us into Cycle Day 3: This is a shortened holiday week with Good Friday closed. Bulls maintain control above 5290 – 5295 zone and a reclaim above 5305 – 5310 zone which would target recent highs. Should they “slip on soap bar” lower objectives measure 5275 – 5265 3 Day Central Pivot Zone.
As always, our tactical trade plan remains unchanged…Stay in alignment with dominant intra-day forces. As such, scenarios to consider for today’s trading.
Bull Scenario: Price sustains a bid above 5295, initially targets 5305 – 5310 zone.
Bear Scenario: Price sustains an offer below 5295, initially targets 5275 – 5265 zone.
PVA High Edge = 5302 PVA Low Edge = 5293 Prior POC = 5300
PTG 3 Day Cycle
EXCLUSIVE OFFER

*****The 3 Day Cycle has a 90% probability of fulfilling Positive Cycle Statistics covering 12 years of recorded tracking history.
Range Projections (ES) June 2024 (M)
- BULL ATR Range Projection >>> 5335
- BEAR ATR Range Projection >>> 5245
Nasdaq 100 (NQ)

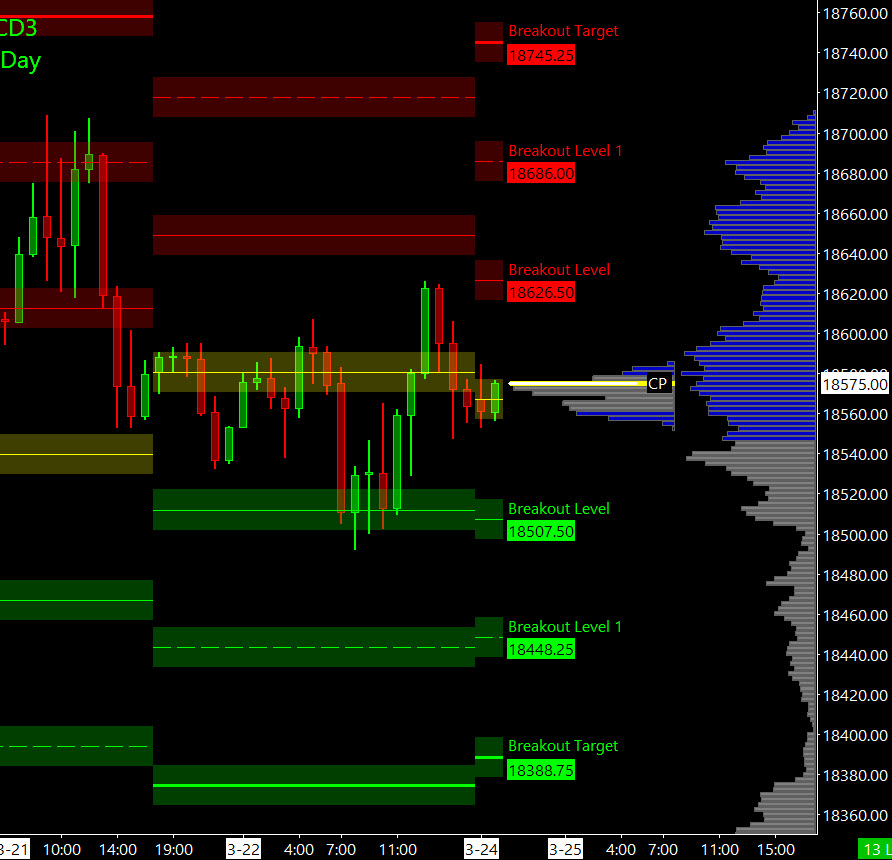
Prior Session was Cycle Day 2: Normal CD2 as price oscillated within PTG’s defined range parameters of 18495 – 18620 which hit perfectly, as outlined in prior DTS Briefing 3.22.24. Range was 126 handles on 392k contracts exchanged.
…Transition from Cycle Day 2 to Cycle Day 3
This leads us into Cycle Day 3: This is a shortened holiday week with Good Friday closed. Bulls maintain control above 18500 and a reclaim above 18600 would target recent highs. Should they “slip on soap bar” lower objectives measure 18450 – 18420 3 Day Central Pivot Zone.
As always, our tactical trade plan remains unchanged…Stay in alignment with dominant intra-day forces. As such, scenarios to consider for today’s trading.
Bull Scenario: Price sustains a bid above 18600, initially targets 18685 – 18745 zone.
Bear Scenario: Price sustains an offer below 18600, initially targets 18450 – 18420 zone.
PVA High Edge = 18577 PVA Low Edge = 18504 Prior POC = 18537
Range Projections (NQ) June 2024 (M)
- BULL ATR Range Projection >>> 18792
- BEAR ATR Range Projection >>> 18344
Trade Strategy: Our tactical trade strategy will simply remain unaltered…We’ll be flexible to trade both long and short side from Decision Pivot Levels. Continue to focus on Bull/Bear Stackers and Premium/Discounts. As always, remaining in alignment with dominant intra-day force increases probabilities of producing winning trades.
Stay Focused…Non-Biased…Disciplined ALWAYS USE STOPS!
Good Trading…David
“Knowing is not enough, We must APPLY. Willing is not enough, We must DO.” –Bruce Lee
*****This trade strategy report is disseminated for “education only” and should not be viewed in any way as a recommendation to buy or sell futures products.”
PAST PERFORMANCE IS NOT NECESSARILY INDICATIVE OF FUTURE RESULTS
IMPORTANT NOTICE! No representation is being made that the use of this strategy or any system or trading methodology will generate profits. Past performance is not necessarily indicative of future results. There is substantial risk of loss associated with trading securities and options on equities. Only risk capital should be used to trade. Trading securities is not suitable for everyone.
Disclaimer: Futures, Options, and Currency trading all have large potential rewards, but they also have large potential risk. You must be aware of the risks and be willing to accept them in order to invest in these markets. Don’t trade with money you can’t afford to lose.
This website is neither a solicitation nor an offer to Buy/Sell futures, options, or currencies. No representation is being made that any account will or is likely to achieve profits or losses similar to those discussed on this web site. The past performance of any trading system or methodology is not necessarily indicative of future results.
CFTC RULE 4.41 –HYPOTHETICAL OR SIMULATED PERFORMANCE RESULTS HAVE CERTAIN LIMITATIONS. UNLIKE AN ACTUAL PERFORMANCE RECORD, SIMULATED RESULTS DO NOT REPRESENT ACTUAL TRADING. ALSO, SINCE THE TRADES HAVE NOT BEEN EXECUTED, THE RESULTS MAY HAVE UNDER-OR-OVER COMPENSATED FOR THE IMPACT, IF ANY, OF CERTAIN MARKET FACTORS, SUCH AS LACK OF LIQUIDITY. SIMULATED TRADING PROGRAMS IN GENERAL ARE ALSO SUBJECT TO THE FACT THAT THEY ARE DESIGNED WITH THE BENEFIT OF HINDSIGHT. NO REPRESENTATION IS BEING MADE THAT ANY ACCOUNT WILL OR IS LIKELY TO ACHIEVE PROFIT OR LOSSES SIMILAR TO THOSE SHOWN