
Markets (Top Stories)

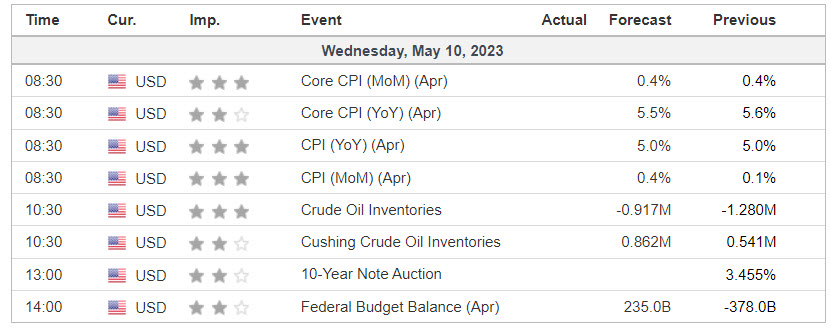
April’s consumer price index, to be released at 8:30 AM ET, will give economists and policymakers fresh data on whether the Fed is succeeding in bringing down the rate of inflation toward its 2% goal.
By the numbers: With core CPI rising 5.6% Y/Y in March, inflation has ebbed from its peak of 9.1% last summer, but remains well above the Fed’s 2% goal. The April number is expected to show little if any progress, with economists expecting the headline CPI number to rise 0.4% in April, up from the 0.1% increase in March (on a Y/Y basis, that comes to a 5.0% rate, unchanged from the prior month’s rate). Core CPI, which excludes the volatile food and energy sectors, is also expected to increase 0.4%, unchanged from the March M/M increase (with a rise of 5.5% Y/Y vs. the March print of 5.6%).
Source: SeekingAlpha.com
Economic Calendar
https://www.investing.com/economic-calendar/

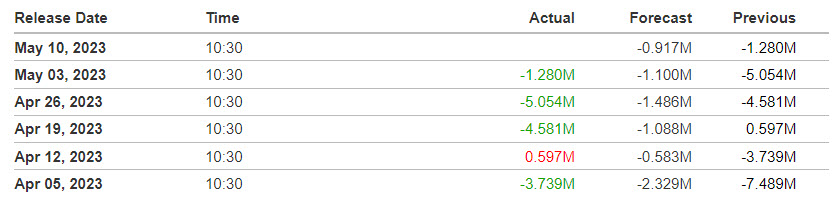
10:30 EIA Petroleum Inventories
S&P 500

***Written Tuesday evening for Wednesday’s trading for contribution to MrTopStep’s “The Opening Print” publication.
Prior Session was Cycle Day 1 (CD1): Normal Cycle Day 1 as price declined establishing a new low at 4131.00 on exceptionally narrow range and light volume, as traders await the all-important CPI print. Prior range was 22 handles on 965k contracts exchanged.
…Transition from Cycle Day 1 to Cycle Day 2
This leads us into Cycle Day 2 (CD2): Big event for today is the CPI Print @ 8:30. Market’s reaction should set the tone for the next directional move. As such, scenarios to consider for today’s trading.
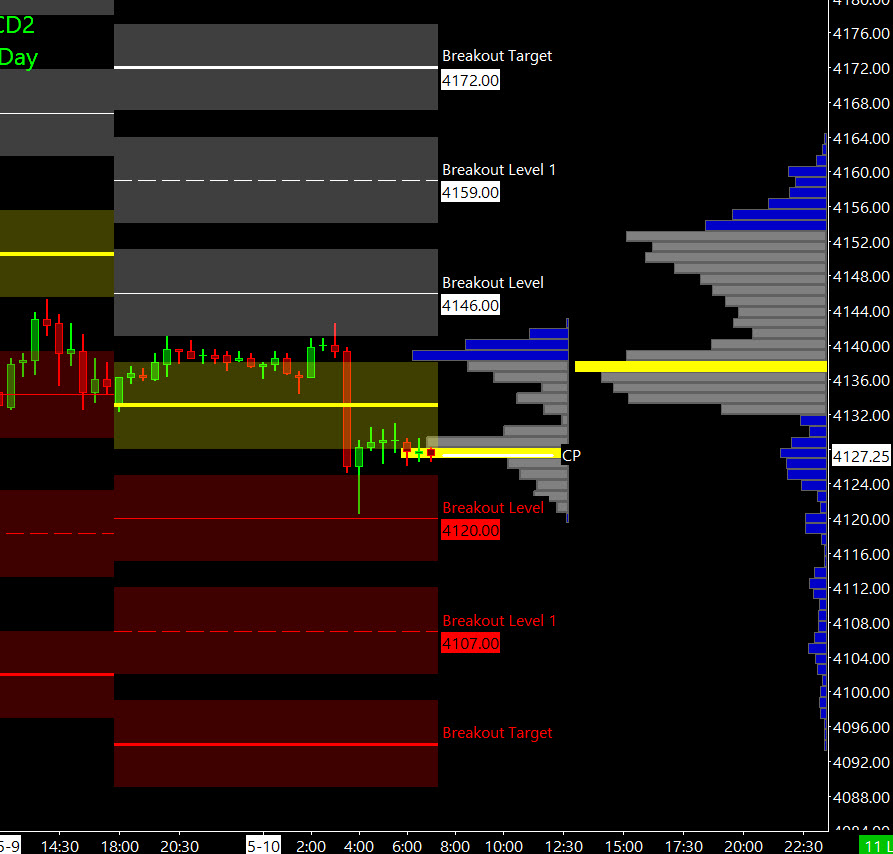
Bull Scenario: Price sustains a bid above 4145, initially targets 4155 – 4160 zone.
Bear Scenario: Price sustains an offer below 4130, initially targets 4115 – 4110 zone.
PVA High Edge = 4140 PVA Low Edge = 4133 Prior POC = 4137
*****The 3 Day Cycle has a 91% probability of fulfilling Positive Cycle Statistics covering 12 years of recorded tracking history.
For more detailed information for both bullish and bearish projected targets, please visit: PTG 3 Day Cycle and/or reference the Cycle Spreadsheet below:
Link to access full Cycle Spreadsheet > > Cycle Day 2 (CD2)
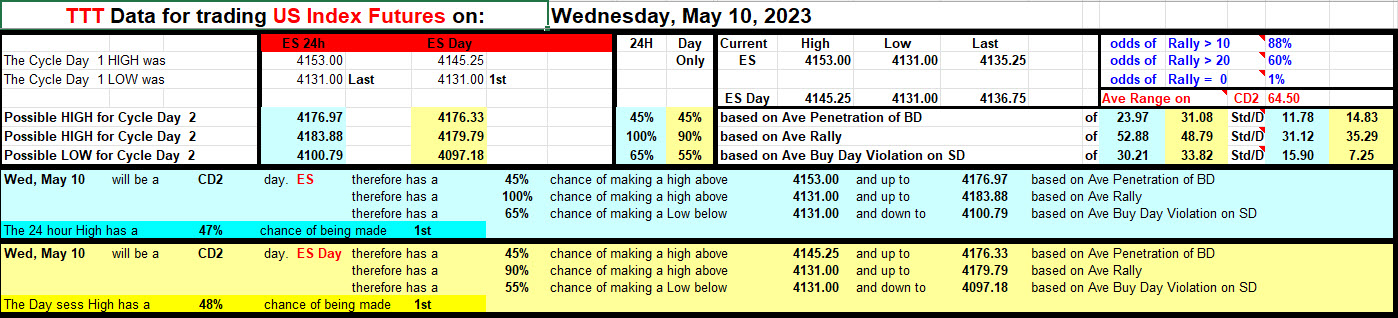
Range Projections and Key Levels (ES) June 2023 (M) Contract
HOD ATR Range Projection: 4177; LOD ATR Range Projection: 4085; 3 Day Central Pivot: 4140; 3 Day Cycle Target: 4202; 10 Day Average True Range 57; VIX: 18
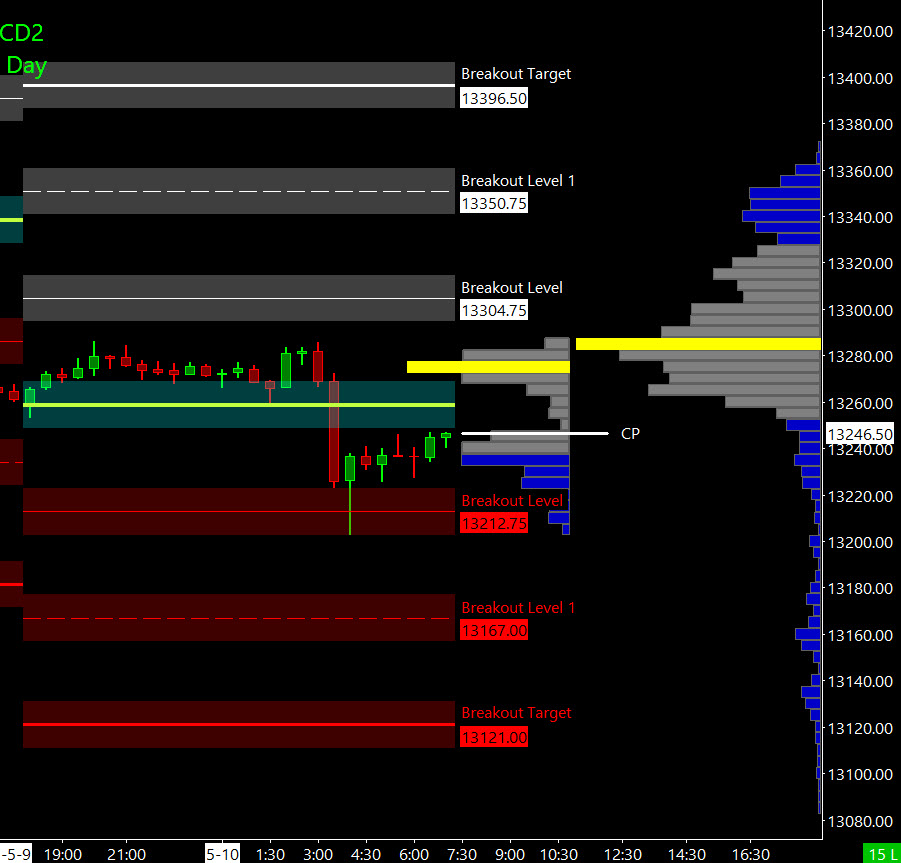
Nasdaq 100 (NQ)

Prior Session was Cycle Day 1 (CD1): Normal Cycle Day 1 as price declined establishing a new low at 13250.50 on exceptionally narrow range and light volume, as traders await the all-important CPI print. Prior range was 96 handles on 502k contracts exchanged.
…Transition from Cycle Day 1 to Cycle Day 2
This leads us into Cycle Day 2 (CD2): Big event for today is the CPI Print @ 8:30. Market’s reaction should set the tone for the next directional move. As such, scenarios to consider for today’s trading.
Bull Scenario: Price sustains a bid above 13250, initially targets 13285 – 13305 zone.
Bear Scenario: Price sustains an offer below 13250, initially targets 13210 – 13200 zone.
PVA High Edge = 13295 PVA Low Edge = 13268 Prior POC = 13285
Range Projections and Key Levels (NQ) June 2023 (M) Contract
HOD ATR Range Projection: 13411; LOD ATR Range Projection: 13077; 3 Day Central Pivot: 13282; 3 Day Cycle Target: 13530; 10 Day Average True Range: 206; VIX: 18
Trade Strategy: Our tactical trade strategy will simply remain unaltered…We’ll be flexible to trade both long and short side from Decision Pivot Levels. Continue to focus on Bull/Bear Stackers and Premium/Discounts. As always, remaining in alignment with dominant intra-day force increases probabilities of producing winning trades.
Stay Focused…Non-Biased…Disciplined ALWAYS USE STOPS!
Good Trading…David
“Knowing is not enough, We must APPLY. Willing is not enough, We must DO.” –Bruce Lee
*****This trade strategy report is disseminated for “education only” and should not be viewed in any way as a recommendation to buy or sell futures products.”
PAST PERFORMANCE IS NOT NECESSARILY INDICATIVE OF FUTURE RESULTS
IMPORTANT NOTICE! No representation is being made that the use of this strategy or any system or trading methodology will generate profits. Past performance is not necessarily indicative of future results. There is substantial risk of loss associated with trading securities and options on equities. Only risk capital should be used to trade. Trading securities is not suitable for everyone.
Disclaimer: Futures, Options, and Currency trading all have large potential rewards, but they also have large potential risk. You must be aware of the risks and be willing to accept them in order to invest in these markets. Don’t trade with money you can’t afford to lose.
This website is neither a solicitation nor an offer to Buy/Sell futures, options, or currencies. No representation is being made that any account will or is likely to achieve profits or losses similar to those discussed on this web site. The past performance of any trading system or methodology is not necessarily indicative of future results.
CFTC RULE 4.41 –HYPOTHETICAL OR SIMULATED PERFORMANCE RESULTS HAVE CERTAIN LIMITATIONS. UNLIKE AN ACTUAL PERFORMANCE RECORD, SIMULATED RESULTS DO NOT REPRESENT ACTUAL TRADING. ALSO, SINCE THE TRADES HAVE NOT BEEN EXECUTED, THE RESULTS MAY HAVE UNDER-OR-OVER COMPENSATED FOR THE IMPACT, IF ANY, OF CERTAIN MARKET FACTORS, SUCH AS LACK OF LIQUIDITY. SIMULATED TRADING PROGRAMS IN GENERAL ARE ALSO SUBJECT TO THE FACT THAT THEY ARE DESIGNED WITH THE BENEFIT OF HINDSIGHT. NO REPRESENTATION IS BEING MADE THAT ANY ACCOUNT WILL OR IS LIKELY TO ACHIEVE PROFIT OR LOSSES SIMILAR TO THOSE SHOWN