
Markets (Top Stories)
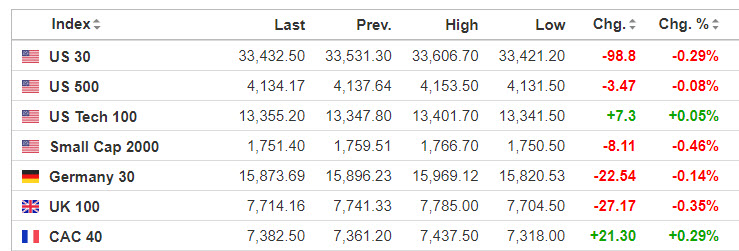
Source: SeekingAlpha.com
Economic Calendar
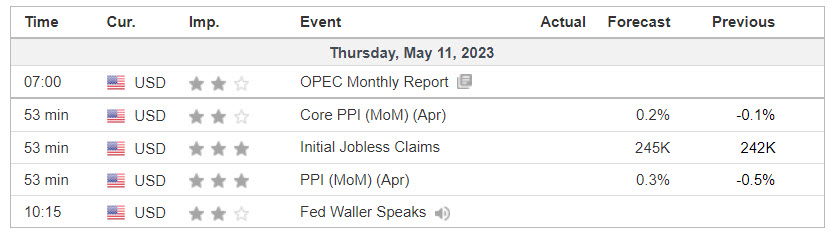
https://www.investing.com/economic-calendar/
S&P 500

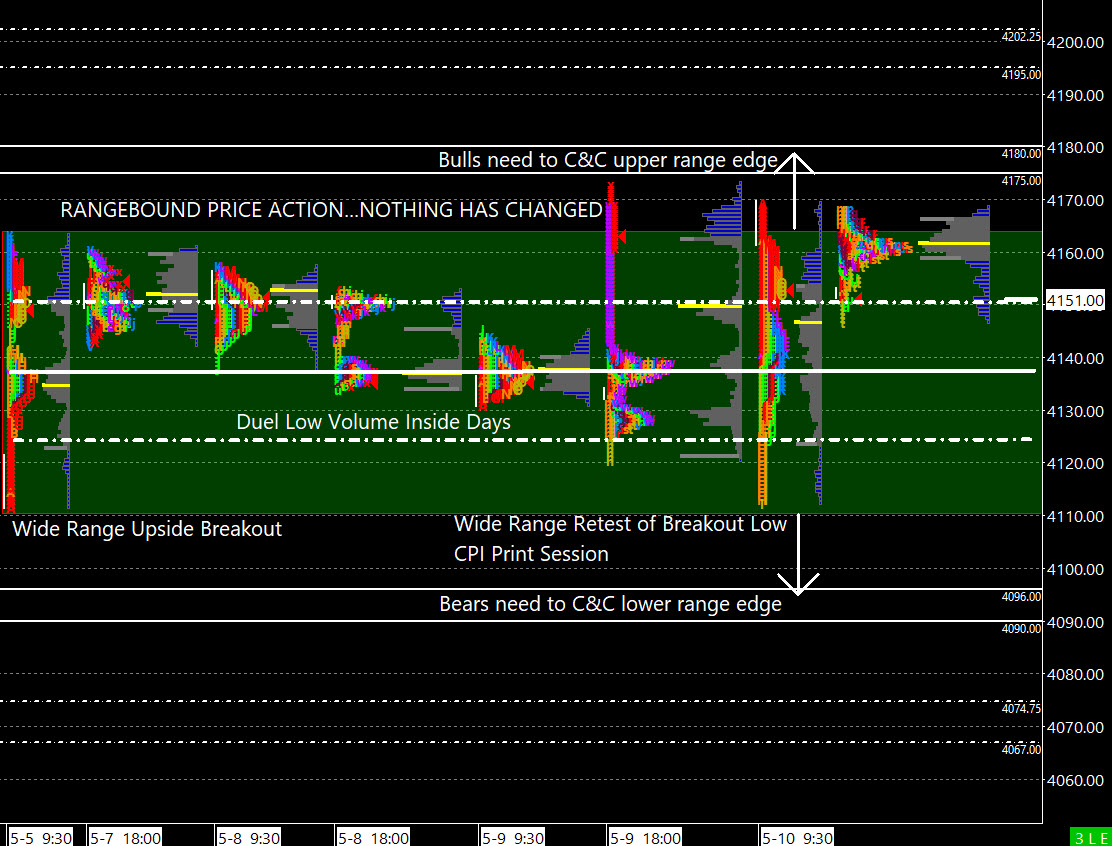
Prior Session was Cycle Day 2 (CD2): CPI Print created a “range runner” session as price tagged and reversed from our upper and lower targets outlined in DTS Briefing 5.10.23. Trading Room posting’s provide our community real-time guidance as to market dynamics.
PTGDavid :(10:06:55 AM) : Now today they just going to rip it wide in each direction
PTGDavid :(10:19:24 AM) : Range Runner Action
Prior range was 61 handles on 1.824M contracts exchanged.
…Transition from Cycle Day 2 to Cycle Day 3
This leads us into Cycle Day 3 (CD3): Price is currently above CD1 Low (4131) and as long as it stays above this level for RTH, then Positive 3 Day Cycle Statistic will be fulfilled. At that point, it is a “wild-card” for direction. As such, estimated scenarios to consider for today’s trading.
Bull Scenario: Price sustains a bid above 4150, initially targets 4175 – 4180 zone.
Bear Scenario: Price sustains an offer below 4150, initially targets 4135 – 4130 zone.
PVA High Edge = 4155 PVA Low Edge = 4127 Prior POC = 4146
Range Projections and Key Levels (ES) June 2023 (M) Contract
HOD ATR Range Projection: 4205; LOD ATR Range Projection: 4110; 3 Day Central Pivot: 4145; 3 Day Cycle Target: 4202; 10 Day Average True Range 50; VIX: 17
Nasdaq 100 (NQ)

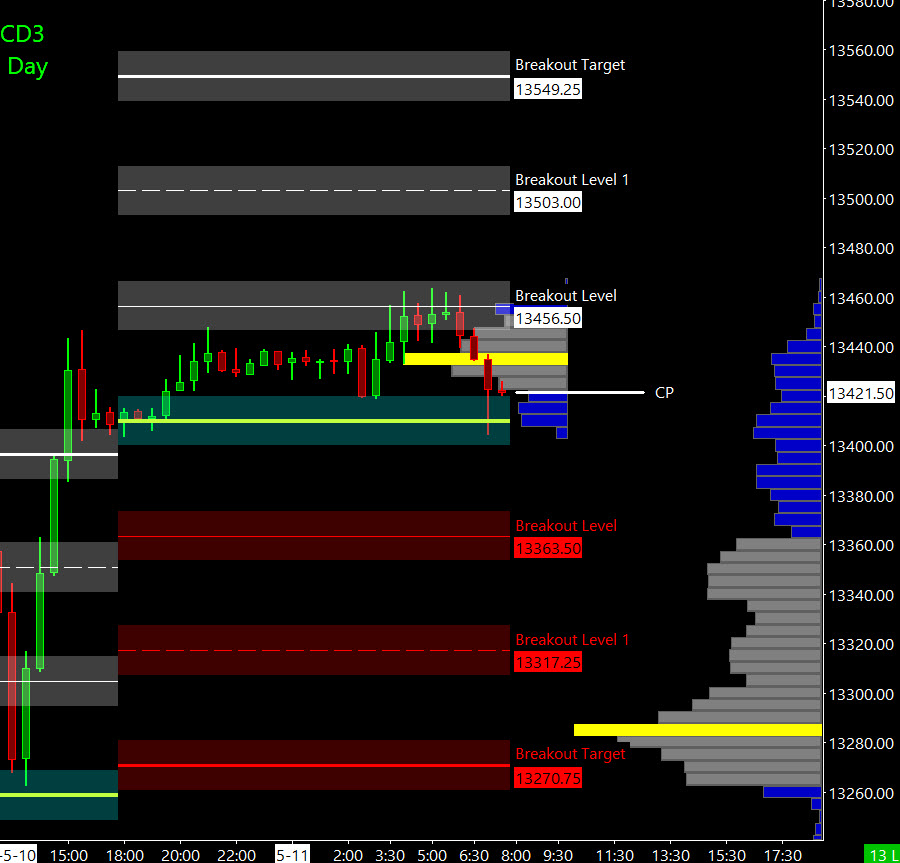
Prior Session was Cycle Day 2 (CD2): CPI Print created a “range runner” session as price tagged and reversed from our upper and lower targets. Trading Room posting’s provide our community real-time guidance as to market dynamics. Prior range was 244 handles on 833k contracts exchanged.
…Transition from Cycle Day 2 to Cycle Day 3
This leads us into Cycle Day 3 (CD3): Price is currently above CD1 Low (13250) and as long as it stays above this level for RTH, then Positive 3 Day Cycle Statistic will be fulfilled. At that point, it is a “wild-card” for direction. As such, estimated scenarios to consider for today’s trading.
Bull Scenario: IF Bulls sustains bid above 13410, THEN initial upside estimate targets 13455– 13465 zone.
Bear Scenario: IF Bears sustains offer below 13410, THEN initial downside estimate targets 13375 – 13355 zone.
PVA High Edge = 13434 PVA Low Edge = 13339 Prior POC = 13386
Range Projections and Key Levels (NQ) June 2023 (M) Contract
HOD ATR Range Projection: 13616; LOD ATR Range Projection: 13250; 3 Day Central Pivot: 13320; 3 Day Cycle Target: 13530; 10 Day Average True Range: 196; VIX: 17
Trade Strategy: Our tactical trade strategy will simply remain unaltered…We’ll be flexible to trade both long and short side from Decision Pivot Levels. Continue to focus on Bull/Bear Stackers and Premium/Discounts. As always, remaining in alignment with dominant intra-day force increases probabilities of producing winning trades.
Stay Focused…Non-Biased…Disciplined ALWAYS USE STOPS!
Good Trading…David
“Knowing is not enough, We must APPLY. Willing is not enough, We must DO.” –Bruce Lee
*****This trade strategy report is disseminated for “education only” and should not be viewed in any way as a recommendation to buy or sell futures products.”
PAST PERFORMANCE IS NOT NECESSARILY INDICATIVE OF FUTURE RESULTS
IMPORTANT NOTICE! No representation is being made that the use of this strategy or any system or trading methodology will generate profits. Past performance is not necessarily indicative of future results. There is substantial risk of loss associated with trading securities and options on equities. Only risk capital should be used to trade. Trading securities is not suitable for everyone.
Disclaimer: Futures, Options, and Currency trading all have large potential rewards, but they also have large potential risk. You must be aware of the risks and be willing to accept them in order to invest in these markets. Don’t trade with money you can’t afford to lose.
This website is neither a solicitation nor an offer to Buy/Sell futures, options, or currencies. No representation is being made that any account will or is likely to achieve profits or losses similar to those discussed on this web site. The past performance of any trading system or methodology is not necessarily indicative of future results.
CFTC RULE 4.41 –HYPOTHETICAL OR SIMULATED PERFORMANCE RESULTS HAVE CERTAIN LIMITATIONS. UNLIKE AN ACTUAL PERFORMANCE RECORD, SIMULATED RESULTS DO NOT REPRESENT ACTUAL TRADING. ALSO, SINCE THE TRADES HAVE NOT BEEN EXECUTED, THE RESULTS MAY HAVE UNDER-OR-OVER COMPENSATED FOR THE IMPACT, IF ANY, OF CERTAIN MARKET FACTORS, SUCH AS LACK OF LIQUIDITY. SIMULATED TRADING PROGRAMS IN GENERAL ARE ALSO SUBJECT TO THE FACT THAT THEY ARE DESIGNED WITH THE BENEFIT OF HINDSIGHT. NO REPRESENTATION IS BEING MADE THAT ANY ACCOUNT WILL OR IS LIKELY TO ACHIEVE PROFIT OR LOSSES SIMILAR TO THOSE SHOWN