
Markets
Futures are heading higher ahead of the data, following last night’s slump that came amid a protracted trade dispute and intensifying yield curve. Contracts tied to the DJIA are now indicating a 75 point advance, while 10-year Treasury notes eased overnight, but at 2.27%, they are still within touching distance of their September 2017 lows.
In Asia, Japan -0.3%. Hong Kong -0.4%. China -0.3%. India +0.7%.
In Europe, at midday, London +0.5%. Paris +0.4%. Frankfurt +0.4%.
Futures at 6:20, Dow +0.3%. S&P +0.4%. Nasdaq +0.4%. Crude +0.2% to $58.92. Gold flat at $1280.70. Bitcoin +0.6% to $8730.
Ten-year Treasury Yield +3 bps to 2.27%
(Source: Seeking Alpha)
Economic Calendar
8:30GDP Q1
8:30International trade in goods
8:30Retail Inventories (Advance)
8:30Wholesale Inventories (Advance)
8:30Initial Jobless Claims
8:30Corporate profits
10:00Pending Home Sales
10:30EIA Natural Gas Inventory
11:00EIA Petroleum Inventories
12:00 PMFed’s Clarida: “Sustaining Maximum Employment and Price Stability”
4:30 PMMoney Supply
4:30 PMFed Balance Sheet
*****New PTG Trading Room Chat Log’s Link
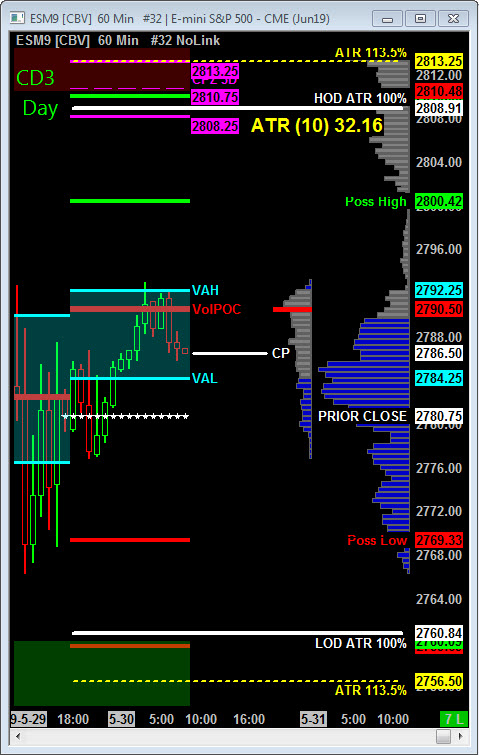
S&P 500
Today is Cycle Day 3 …Price has struggled this cycle and currently still below Cycle Day 1 Low (2800.50). Historical Odds favor recovery back to and/or above this level to fulfill Positive 3 Day Cycle Statistic. Stay Tuned!
CD3 Range High = 2800.50 CD3 Range Low = 2769.50 CD3 Range Avg = 33.50
Scenario 1: IF Bulls hold bid above 2780, THEN initial upside targets 2800.50 – 2806 zone.
Scenario 2: IF Bears hold offer below 2780, THEN initial downside targets 2769.50 – 2766.25 zone.
Range Projections and Key Levels (ES) June (M) Contract
HOD ATR Range Projection: 2809.00; LOD ATR Range Projection: 2761.00; Cycle Day 1 Low: 2800.50; 3 Day Central Pivot: 2860.00; 3 Day Cycle Target: 2810.75; 10 Day Average True Range 32.16; VIX: 17.40
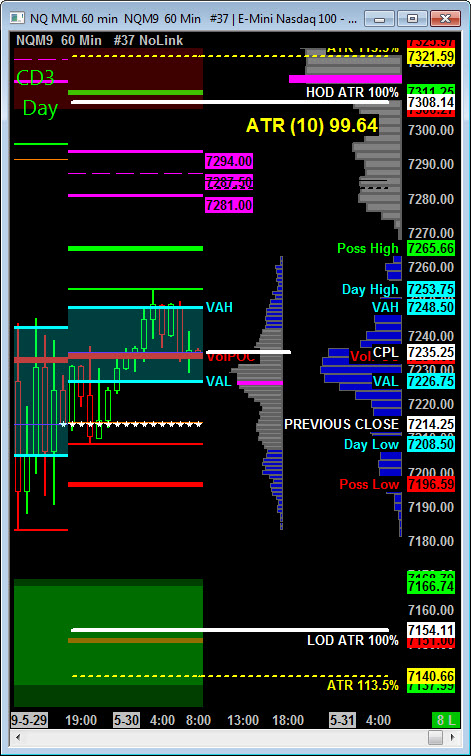
Nasdaq 100 (NQ)
Today is Cycle Day 3…Price has struggled this cycle and currently still below Cycle Day 1 Low (7280.25). Historical Odds favor recovery back to and/or above this level to fulfill Positive 3 Day Cycle Statistic. Stay Tuned!
CD3 Range High = 7265.50 CD3 Range Low = 7196.50 CD3 Range Avg = 102.00
Scenario 1: IF Bulls hold bid above 7214, THEN initial upside potential targets 7265.50 – 7280.25 zone.
Scenario 2: IF Bears hold offer below 7214, THEN initial downside targets 7196.50 – 7183.25 zone.
Range Projections and Key Levels (NQ) June (M) Contract
HOD ATR Range Projection: 7308.00; LOD ATR Range Projection: 7154.00; Cycle Day 1 Low: 7280.25; 3 Day Central Pivot: 7287.50; 3 Day Cycle Target: 7348.00; 10 Day Average True Range: 99.64; VIX: 17.40
Trade Strategy: Our tactical trade strategy will simply remain unaltered…We’ll be flexible to trade both long and short side from Decision Pivot Levels. Continue to focus on Bull/Bear Stackers and Premium/Discounts. As always, remaining in alignment with dominant intra-day force increases probabilities of producing winning trades.
Stay Focused…Non-Biased…Disciplined ALWAYS USE STOPS!
Good Trading…David
“Knowing is not enough, We must APPLY. Willing is not enough, We must DO.” –Bruce Lee
*****This trade strategy report is disseminated for “education only” and should not be viewed in any way as a recommendation to buy or sell futures products.”
PAST PERFORMANCE IS NOT NECESSARILY INDICATIVE OF FUTURE RESULTS
IMPORTANT NOTICE! No representation is being made that the use of this strategy or any system or trading methodology will generate profits. Past performance is not necessarily indicative of future results. There is substantial risk of loss associated with trading securities and options on equities. Only risk capital should be used to trade. Trading securities is not suitable for everyone.
Disclaimer: Futures, Options, and Currency trading all have large potential rewards, but they also have large potential risk. You must be aware of the risks and be willing to accept them in order to invest in these markets. Don’t trade with money you can’t afford to lose.
This website is neither a solicitation nor an offer to Buy/Sell futures, options, or currencies. No representation is being made that any account will or is likely to achieve profits or losses similar to those discussed on this web site. The past performance of any trading system or methodology is not necessarily indicative of future results.
CFTC RULE 4.41 –HYPOTHETICAL OR SIMULATED PERFORMANCE RESULTS HAVE CERTAIN LIMITATIONS. UNLIKE AN ACTUAL PERFORMANCE RECORD, SIMULATED RESULTS DO NOT REPRESENT ACTUAL TRADING. ALSO, SINCE THE TRADES HAVE NOT BEEN EXECUTED, THE RESULTS MAY HAVE UNDER-OR-OVER COMPENSATED FOR THE IMPACT, IF ANY, OF CERTAIN MARKET FACTORS, SUCH AS LACK OF LIQUIDITY. SIMULATED TRADING PROGRAMS IN GENERAL ARE ALSO SUBJECT TO THE FACT THAT THEY ARE DESIGNED WITH THE BENEFIT OF HINDSIGHT. NO REPRESENTATION IS BEING MADE THAT ANY ACCOUNT WILL OR IS LIKELY TO ACHIEVE PROFIT OR LOSSES SIMILAR TO THOSE SHOWN