
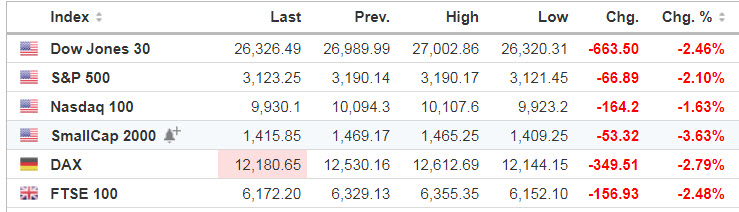
Markets
U.S. stock index futures, along with global stocks, are taking another turn for the worse as investors cash out of an extraordinary rally following the latest comments from Fed Chair Jerome Powell.
The Fed sees GDP plunging 6.5% in 2020 (before bouncing back to a 5% gain in 2021) and the unemployment rate to be 9.3% at year’s end.
Source: SeekingAlpha.com
Economic Calendar
8:30 Initial Jobless Claims
8:30 Producer Price Index
10:00 Quarterly Services Report
10:30 EIA Natural Gas Inventory
https://www.investing.com/economic-calendar/
***New: PTG Trading Room Chat Log’s Link
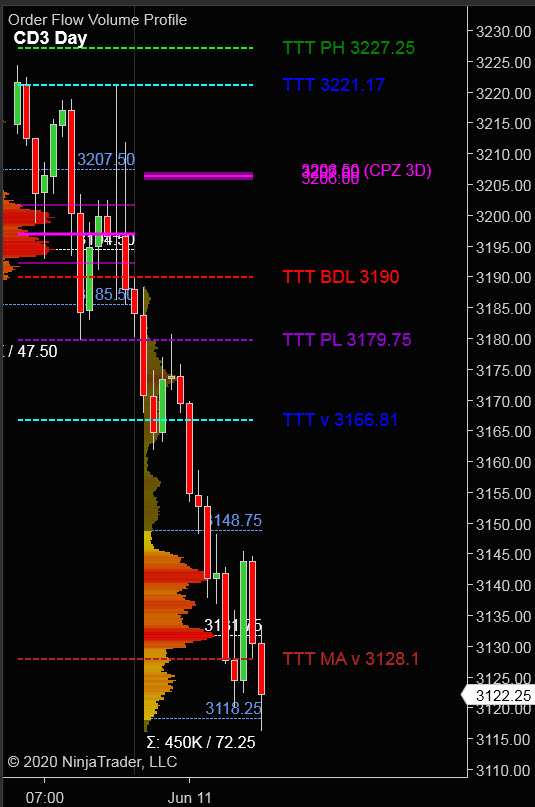
S&P 500
Prior Session was Cycle Day 2 (CD2): Volatile FED Day price action with a negative B-Shaped Profile skew which suggests aggressive selling drove price to low end of range by settlement.
…Transition from Cycle Day 2 to Cycle Day 3
This leads us into Cycle Day 3 (CD3): Having closed near session low and having fulfilled 3 Day Cycle Objectives, we then have Two Scenarios to consider.
1.) Price continues lower violating PL (3179.75) targeting 3128 – 3126 CD2 Violation Zone. (FULFILLED DURING GLOBEX SESSION)
2.) Price holds at or above PL (3179.75) recovering 3210 – 3215 zone.
*****3 Day Cycle has a 91% probability of fulfilling Positive Statistic covering 12 years of recorded tracking history.
PVA High Edge = 3207 PVA Low Edge = 3185 Prior POC = 3194
Range Projections and Key Levels (ES) June 2020 (M) Contract
HOD ATR Range Projection: 3198; LOD ATR Range Projection: 3130; 3 Day Central Pivot: 3206; 3 Day Cycle Target: 3214; 10 Day Average True Range 47.25; VIX: 30.60
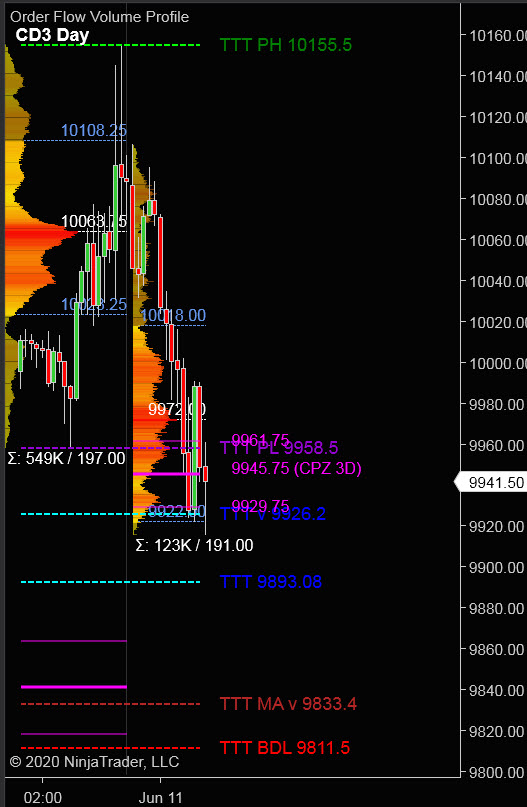
Nasdaq 100 (NQ)
Today is Cycle Day 3 (CD3)…Price has fulfilled Positive 3 Day Cycle Statistic and achieved milestone of notching new All-Time High during previous session. FED Day was a catalyst for aggressive profit-taking as sellers pummeled price into the closing bell.
PVA High Edge = 10108 PVA Low Edge = 10023 Prior POC = 10064
Bull Scenario: IF Bulls hold bid above 9975, THEN initial upside estimate targets 10000 – 10020 zone.
Bear Scenario: IF Bears hold offer below 9975, THEN initial downside estimate targets 9935 – 9925 zone.
Range Projections and Key Levels (NQ) June 2020 (M) Contract
HOD ATR Range Projection: 10174; LOD ATR Range Projection: 9934; 3 Day Central Pivot: 9945; 3 Day Cycle Target: 9998; 10 Day Average True Range: 156; VIX: 30.60
Trade Strategy: Our tactical trade strategy will simply remain unaltered…We’ll be flexible to trade both long and short side from Decision Pivot Levels. Continue to focus on Bull/Bear Stackers and Premium/Discounts. As always, remaining in alignment with dominant intra-day force increases probabilities of producing winning trades.
Stay Focused…Non-Biased…Disciplined ALWAYS USE STOPS!
Good Trading…David
“Knowing is not enough, We must APPLY. Willing is not enough, We must DO.” –Bruce Lee
*****This trade strategy report is disseminated for “education only” and should not be viewed in any way as a recommendation to buy or sell futures products.”
PAST PERFORMANCE IS NOT NECESSARILY INDICATIVE OF FUTURE RESULTS
IMPORTANT NOTICE! No representation is being made that the use of this strategy or any system or trading methodology will generate profits. Past performance is not necessarily indicative of future results. There is substantial risk of loss associated with trading securities and options on equities. Only risk capital should be used to trade. Trading securities is not suitable for everyone.
Disclaimer: Futures, Options, and Currency trading all have large potential rewards, but they also have large potential risk. You must be aware of the risks and be willing to accept them in order to invest in these markets. Don’t trade with money you can’t afford to lose.
This website is neither a solicitation nor an offer to Buy/Sell futures, options, or currencies. No representation is being made that any account will or is likely to achieve profits or losses similar to those discussed on this web site. The past performance of any trading system or methodology is not necessarily indicative of future results.
CFTC RULE 4.41 –HYPOTHETICAL OR SIMULATED PERFORMANCE RESULTS HAVE CERTAIN LIMITATIONS. UNLIKE AN ACTUAL PERFORMANCE RECORD, SIMULATED RESULTS DO NOT REPRESENT ACTUAL TRADING. ALSO, SINCE THE TRADES HAVE NOT BEEN EXECUTED, THE RESULTS MAY HAVE UNDER-OR-OVER COMPENSATED FOR THE IMPACT, IF ANY, OF CERTAIN MARKET FACTORS, SUCH AS LACK OF LIQUIDITY. SIMULATED TRADING PROGRAMS IN GENERAL ARE ALSO SUBJECT TO THE FACT THAT THEY ARE DESIGNED WITH THE BENEFIT OF HINDSIGHT. NO REPRESENTATION IS BEING MADE THAT ANY ACCOUNT WILL OR IS LIKELY TO ACHIEVE PROFIT OR LOSSES SIMILAR TO THOSE SHOWN