
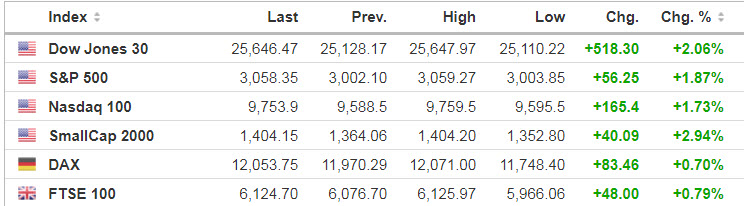
Markets
Thursday was an ugly day (IF YOU WERE LONG) on Wall Street, as stocks posted their worst day since March, though some of the massive losses might be recouped as S&P 500 futures rebounded 2% overnight.
Source: Seeking Alpha https://seekingalpha.com/
Economic Calendar
8:30 Import/Export Prices
10:00 Consumer Sentiment
1:00 PM Baker-Hughes Rig Count
https://www.investing.com/economic-calendar/
S&P 500
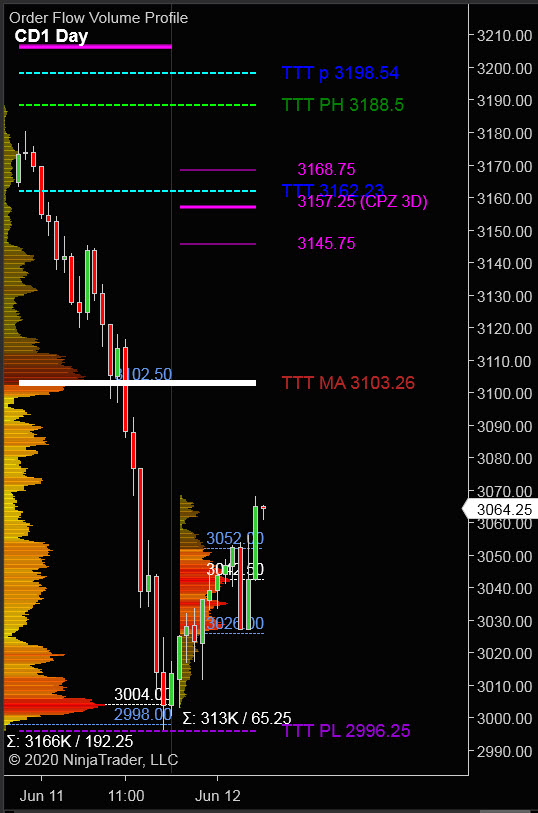
Prior Session was Cycle Day 3 (CD3): Price failed to notch Positive 3 Day Rally, as price is required to be at or above Cycle day 1 Low during Cycle Day 3. Prior session range was 192 handles and down 5.9%. Recovering that loss will be a challenge for bulls.
…Transition from Cycle Day 3 to Cycle Day 1
This leads us into Cycle Day 1 (CD1): Normal for CD1 is for some magnitude decline. Having exceeded all downside projections and closing near lows, expectation for today is for some percentage relief rally. Currently as of this writing (4:45 am est) price has rallied approximately 50 handles to 3065. Anticipating some initial resistance between 3065 – 70 zone.
P-VA High = 3102 P-VA Low = 2998 P-POC = 3004
Bull Scenario: IF Bulls hold bid above 3065, THEN initial upside estimate targets 3095 – 3100 zone
Bear Scenario: IF Bears hold offer below 3065, THEN initial downside estimate targets 3040 – 3030 zone.
Range Projections and Key Levels (ES) June 2020 (M) Contract
HOD ATR Range Projection: 3070; LOD ATR Range Projection: 2988; 3 Day Central Pivot: 3157; 10 Day Average True Range 62; VIX: 37
Nasdaq 100 (NQ)
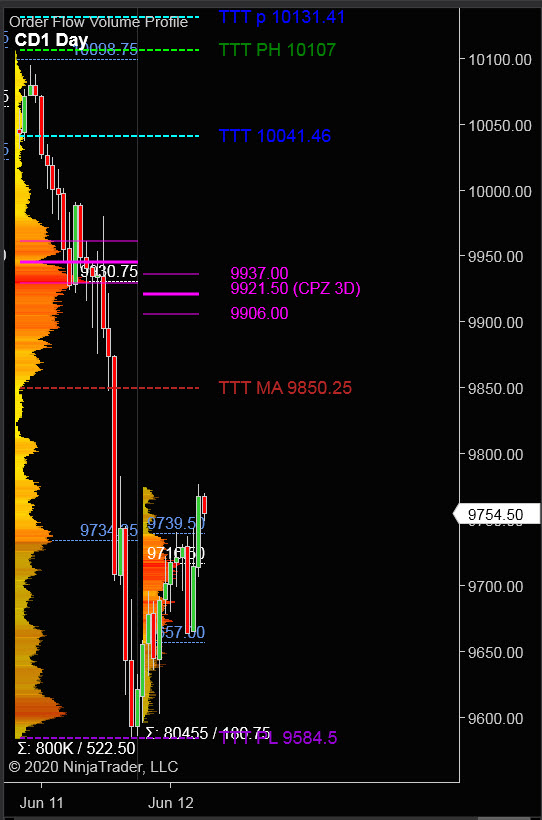
Today is Cycle Day 1 (CD1)…Price has declined during prior session far in excess of normal range projections. Expectation for today is some percentage relief rally with initial upside estimates targeting 9782 – 9810 zone.
P-VA High = 10000 P-VA Low = 9735 P-POC = 9931
Bull Scenario: IF Bulls hold bid above 9770, THEN initial upside estimate targets 9845 – 9860 zone.
Bear Scenario: IF Bears hold offer below 9770, THEN initial downside estimate targets 9730 – 9720 zone.
Range Projections and Key Levels (NQ) June 2020 (M) Contract
HOD ATR Range Projection: 9790; LOD ATR Range Projection: 9584; 3 Day Central Pivot: 9921; 10 Day Average True Range: 189; VIX: 37
Trade Strategy: Our tactical trade strategy will simply remain unaltered…We’ll be flexible to trade both long and short side from Decision Pivot Levels. Continue to focus on Bull/Bear Stackers and Premium/Discounts. As always, remaining in alignment with dominant intra-day force increases probabilities of producing winning trades.
Stay Focused…Non-Biased…Disciplined ALWAYS USE STOPS!
Good Trading…David
“Knowing is not enough, We must APPLY. Willing is not enough, We must DO.” –Bruce Lee
*****This trade strategy report is disseminated for “education only” and should not be viewed in any way as a recommendation to buy or sell futures products.”
PAST PERFORMANCE IS NOT NECESSARILY INDICATIVE OF FUTURE RESULTS
IMPORTANT NOTICE! No representation is being made that the use of this strategy or any system or trading methodology will generate profits. Past performance is not necessarily indicative of future results. There is substantial risk of loss associated with trading securities and options on equities. Only risk capital should be used to trade. Trading securities is not suitable for everyone.
Disclaimer: Futures, Options, and Currency trading all have large potential rewards, but they also have large potential risk. You must be aware of the risks and be willing to accept them in order to invest in these markets. Don’t trade with money you can’t afford to lose.
This website is neither a solicitation nor an offer to Buy/Sell futures, options, or currencies. No representation is being made that any account will or is likely to achieve profits or losses similar to those discussed on this web site. The past performance of any trading system or methodology is not necessarily indicative of future results.
CFTC RULE 4.41 –HYPOTHETICAL OR SIMULATED PERFORMANCE RESULTS HAVE CERTAIN LIMITATIONS. UNLIKE AN ACTUAL PERFORMANCE RECORD, SIMULATED RESULTS DO NOT REPRESENT ACTUAL TRADING. ALSO, SINCE THE TRADES HAVE NOT BEEN EXECUTED, THE RESULTS MAY HAVE UNDER-OR-OVER COMPENSATED FOR THE IMPACT, IF ANY, OF CERTAIN MARKET FACTORS, SUCH AS LACK OF LIQUIDITY. SIMULATED TRADING PROGRAMS IN GENERAL ARE ALSO SUBJECT TO THE FACT THAT THEY ARE DESIGNED WITH THE BENEFIT OF HINDSIGHT. NO REPRESENTATION IS BEING MADE THAT ANY ACCOUNT WILL OR IS LIKELY TO ACHIEVE PROFIT OR LOSSES SIMILAR TO THOSE SHOWN