
Markets
Recession fears took hold yesterday as short-term Treasurys paid more than long-term notes, a warning sign that investors are rapidly shifting their money into bonds to shield against potential losses they could incur by holding equities. No trouble? A brief inversion could be just an anomaly (others have not preceded recessions), but it may depend on how long the condition lasts. Others say the inversion occurred because of the Federal Reserve, which has kept its base short-term rate “too high,” while some maintain the yield curve has been distorted by more than $15T worth of foreign bonds that pay negative interest rates.
The inversion sent all three major U.S. indexes down about 3% on Wednesday, with the Dow plunging 800 points and suffering its largest decline of the year. The yield on the 30-year Treasury also went into uncharted territory: below 2%. Despite the market meltdown, U.S. stock index futures posted solid gains overnight, before turning around on events in Asia. China’s finance ministry said it must take necessary measures to counter the latest U.S. tariffs on $300B of Chinese goods, while Hong Kong cut its GDP growth forecast to potentially flat for the rest of the year.
In Asia, Japan -1.2%. Hong Kong +0.8%. China +0.3%. India +1%.
In Europe, at midday, London -1.1%. Paris -0.9%. Frankfurt -1%.
Futures at 6:20, Dow -0.4%. S&P -0.3%. Nasdaq -0.5%. Crude -1.5% to $54.38. Gold +0.1% to $1528.70. Bitcoin -5.1% to $9931.
Ten-year Treasury Yield -3 bps to 1.55%
Source: Seeking Alpha https://seekingalpha.com/
Economic Calendar: https://www.investing.com/economic-calendar/
8:30Initial Jobless Claims
8:30Philly Fed Business Outlook
8:30Retail Sales
8:30Empire State Mfg Survey
8:30Productivity and Costs
9:15Industrial Production
10:00NAHB Housing Market Index
10:00Business Inventories
10:30EIA Natural Gas Inventory
4:00 PMTreasury International Capital
4:30 PMMoney Supply
4:30 PMFed Balance Sheet
***New: PTG Trading Room Chat Log’s Link
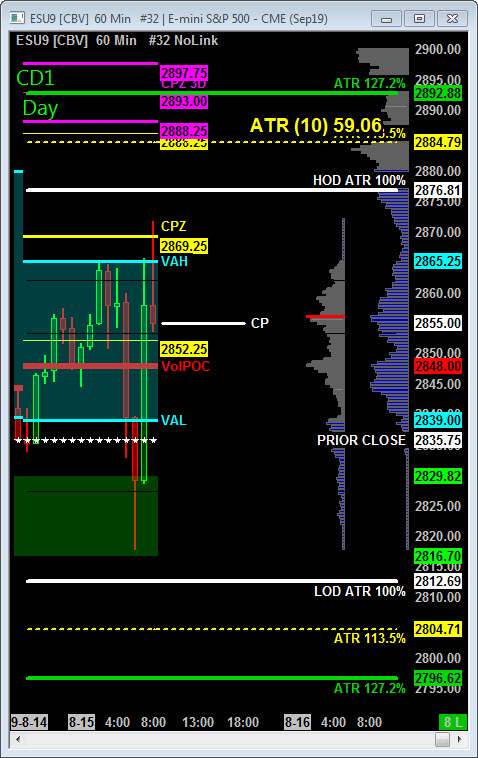
S&P 500
Today is Cycle Day 1 (CD1)…Normal is for a decline measuring 2902 (FULFILLED). ***In-Fact CD1 Violation DPZ (2823.25 – 2816.75) has been FULFILLED with price reversing higher from this zone. Average Range for CD1 is 33.50 handles. Odds of decline > 10 handles = 73% Odds of decline > 20 = 43%
CD1 Range High = 2851.00 CD1 Range Low = 2832.00 CD1 Range Avg = 33.50
Scenario 1: IF Bulls hold bid above 2848, THEN initial upside targets 2862 – 2870 zone.
Scenario 2: IF Bears hold offer below 2848, THEN initial downside targets 2823.25 – 2816.75 zone.
Range Projections and Key Levels (ES) September 2019 (U) Contract
HOD ATR Range Projection: 2877.00; LOD ATR Range Projection: 2806.00; 3 Day Central Pivot: 2893.00; 3 Day Cycle Target: 2862.00; 10 Day Average True Range 59.00; VIX: 22.64
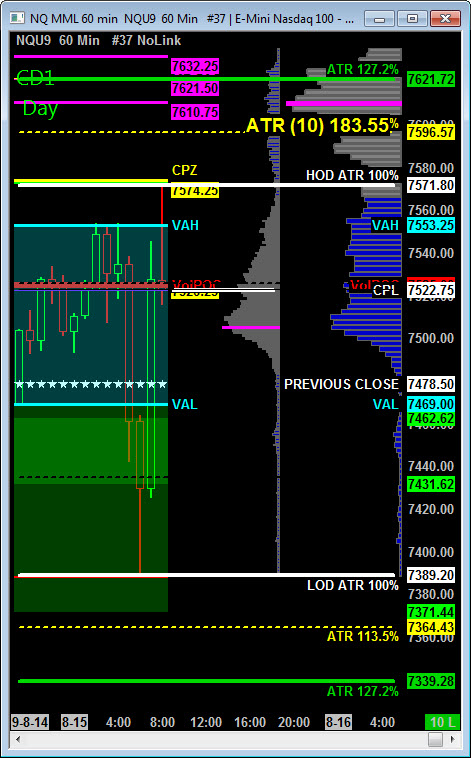
Nasdaq 100 (NQ)
Today is Cycle Day 1 (CD1)…Normal is for a decline measuring 7646 (FULFILLED). ***In-Fact CD1 Violation DPZ (7447 – 7420) has been FULFILLED with price reversing higher from this zone. Average Range for CD1 is 117.00 handles. Odds of decline > 20 handles = 74% Odds of decline > 25 = 66%
CD1 Range High =7504.00 CD1 Range Low = 7456.00 CD1 Range Avg = 117.00
Scenario 1: IF Bulls hold bid above 7525, THEN initial upside targets 7568 – 7575 zone.
Scenario 2: IF Bears hold offer below 7525, THEN initial downside targets 7447 – 7420 zone.
Range Projections and Key Levels (NQ) September 2019 (U) Contract
HOD ATR Range Projection: 7572.00; LOD ATR Range Projection: 7389.00; 3 Day Central Pivot: 7621.00; 3 Day Cycle Target: 7546.00; 10 Day Average True Range: 183.55; VIX: 22.64
Trade Strategy: Our tactical trade strategy will simply remain unaltered…We’ll be flexible to trade both long and short side from Decision Pivot Levels. Continue to focus on Bull/Bear Stackers and Premium/Discounts. As always, remaining in alignment with dominant intra-day force increases probabilities of producing winning trades.
Stay Focused…Non-Biased…Disciplined ALWAYS USE STOPS!
Good Trading…David
“Knowing is not enough, We must APPLY. Willing is not enough, We must DO.” –Bruce Lee
*****This trade strategy report is disseminated for “education only” and should not be viewed in any way as a recommendation to buy or sell futures products.”
PAST PERFORMANCE IS NOT NECESSARILY INDICATIVE OF FUTURE RESULTS
IMPORTANT NOTICE! No representation is being made that the use of this strategy or any system or trading methodology will generate profits. Past performance is not necessarily indicative of future results. There is substantial risk of loss associated with trading securities and options on equities. Only risk capital should be used to trade. Trading securities is not suitable for everyone.
Disclaimer: Futures, Options, and Currency trading all have large potential rewards, but they also have large potential risk. You must be aware of the risks and be willing to accept them in order to invest in these markets. Don’t trade with money you can’t afford to lose.
This website is neither a solicitation nor an offer to Buy/Sell futures, options, or currencies. No representation is being made that any account will or is likely to achieve profits or losses similar to those discussed on this web site. The past performance of any trading system or methodology is not necessarily indicative of future results.
CFTC RULE 4.41 –HYPOTHETICAL OR SIMULATED PERFORMANCE RESULTS HAVE CERTAIN LIMITATIONS. UNLIKE AN ACTUAL PERFORMANCE RECORD, SIMULATED RESULTS DO NOT REPRESENT ACTUAL TRADING. ALSO, SINCE THE TRADES HAVE NOT BEEN EXECUTED, THE RESULTS MAY HAVE UNDER-OR-OVER COMPENSATED FOR THE IMPACT, IF ANY, OF CERTAIN MARKET FACTORS, SUCH AS LACK OF LIQUIDITY. SIMULATED TRADING PROGRAMS IN GENERAL ARE ALSO SUBJECT TO THE FACT THAT THEY ARE DESIGNED WITH THE BENEFIT OF HINDSIGHT. NO REPRESENTATION IS BEING MADE THAT ANY ACCOUNT WILL OR IS LIKELY TO ACHIEVE PROFIT OR LOSSES SIMILAR TO THOSE SHOWN