
Markets
Equities somewhat stabilized yesterday after days of wild swings, with DJIA futures now up by 260 points and S&P 500 and Nasdaq futures ahead by 1% and 1.4%, respectively.
In Asia, Japan -0.2%. Hong Kong +0.9%. China +0.3%. India +0.1%.
In Europe, at midday, London +0.6%. Paris +1%. Frankfurt +1%.
Futures at 6:20, Dow +1%. S&P +1%. Nasdaq +1.4%. Crude +1.8% to $55.43. Gold -0.7% to $1520. Bitcoin -0.1% to $10063.
Ten-year Treasury Yield +4 to 1.56%
Source: Seeking Alpha https://seekingalpha.com
Economic Calendar https://www.investing.com/economic-calendar/
8:30Housing Starts
10:00Quarterly Services Report (Advance)
10:00Consumer Sentiment
1:00 PMBaker-Hughes Rig Count
***PTG Trading Room Chat Log’s Link
S&P 500
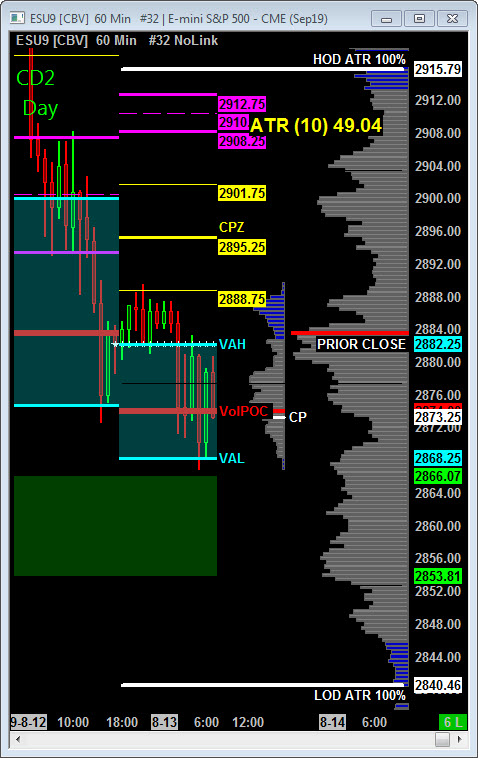
Today is Cycle Day 2 (CD2)…Normal price action would be for once CD1 Low (2817.75) is established, price to successfully retest for surety and then begin rallying to Cycle objectives.
*****The 3 Day Cycle Spreadsheet which subscribers receive shortly after market close for next trading session contains all the projected range targets. Here is link to web page to learn more: https://polaristradinggroup.com/ptg-3-day-cycle/
CD2 Range High = 2886.00 CD2 Range Low = 2841.00 CD2 Range Avg = 37.50
Scenario 1: IF Bulls hold bid above 2850, THEN initial upside potential targets 2874.75 – 2878.75 3 Day Central Pivot Zone.
Scenario 2: IF Bears hold offer below 2850, THEN initial downside objective targets 2841 – 2836 range low zone.
Range Projections and Key Levels (ES) September 2019 (U) Contract
HOD ATR Range Projection: 2904.00; LOD ATR Range Projection: 2824.00; 3 Day Central Pivot: 2876.75; 3 Day Cycle Target: 2862.00; 10 Day Average True Range 54.28: VIX: 19.81
Nasdaq 100 (NQ)
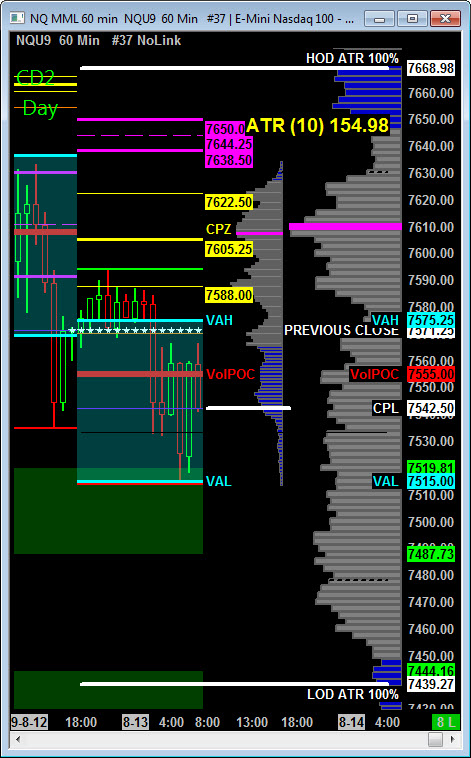
Today is Cycle Day 2 (CD2)…Normal price action would be for once CD1 Low (7388.25) is established, price to successfully retest for surety and then begin rallying to Cycle objectives.
CD2 Range High = 7633.00 CD2 Range Low = 7515.00 CD2 Range Avg = 120.00
Scenario 1: IF Bulls hold bid above 7510, THEN initial upside potential targets 7585 – 7595 CD2 Penetration Decision Point Zone (DPZ).
Scenario 2: IF Bears hold offer below 7510, THEN initial downside objective targets 7500 – 7480 Central Pivot Zone.
Range Projections and Key Levels (NQ) September 2019 (U) Contract
HOD ATR Range Projection: 7670.00; LOD ATR Range Projection: 7632.00; 3 Day Central Pivot: 7583.00; 3 Day Cycle Target: 7546.00; 10 Day Average True Range: 168.31; VIX: 19.81
Trade Strategy: Our tactical trade strategy will simply remain unaltered…We’ll be flexible to trade both long and short side from Decision Pivot Levels. Continue to focus on Bull/Bear Stackers and Premium/Discounts. As always, remaining in alignment with dominant intra-day force increases probabilities of producing winning trades.
Stay Focused…Non-Biased…Disciplined ALWAYS USE STOPS!
Good Trading…David
“Knowing is not enough, We must APPLY. Willing is not enough, We must DO.” –Bruce Lee
*****This trade strategy report is disseminated for “education only” and should not be viewed in any way as a recommendation to buy or sell futures products.”
PAST PERFORMANCE IS NOT NECESSARILY INDICATIVE OF FUTURE RESULTS
IMPORTANT NOTICE! No representation is being made that the use of this strategy or any system or trading methodology will generate profits. Past performance is not necessarily indicative of future results. There is substantial risk of loss associated with trading securities and options on equities. Only risk capital should be used to trade. Trading securities is not suitable for everyone.
Disclaimer: Futures, Options, and Currency trading all have large potential rewards, but they also have large potential risk. You must be aware of the risks and be willing to accept them in order to invest in these markets. Don’t trade with money you can’t afford to lose.
This website is neither a solicitation nor an offer to Buy/Sell futures, options, or currencies. No representation is being made that any account will or is likely to achieve profits or losses similar to those discussed on this web site. The past performance of any trading system or methodology is not necessarily indicative of future results.
CFTC RULE 4.41 –HYPOTHETICAL OR SIMULATED PERFORMANCE RESULTS HAVE CERTAIN LIMITATIONS. UNLIKE AN ACTUAL PERFORMANCE RECORD, SIMULATED RESULTS DO NOT REPRESENT ACTUAL TRADING. ALSO, SINCE THE TRADES HAVE NOT BEEN EXECUTED, THE RESULTS MAY HAVE UNDER-OR-OVER COMPENSATED FOR THE IMPACT, IF ANY, OF CERTAIN MARKET FACTORS, SUCH AS LACK OF LIQUIDITY. SIMULATED TRADING PROGRAMS IN GENERAL ARE ALSO SUBJECT TO THE FACT THAT THEY ARE DESIGNED WITH THE BENEFIT OF HINDSIGHT. NO REPRESENTATION IS BEING MADE THAT ANY ACCOUNT WILL OR IS LIKELY TO ACHIEVE PROFIT OR LOSSES SIMILAR TO THOSE SHOWN