
Markets (Top Stories)
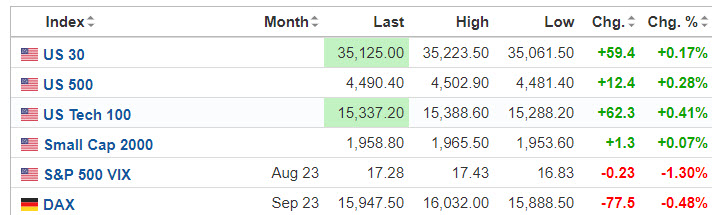
Source: SeekingAlpha.com
Economic Calendar

https://www.investing.com/economic-calendar/
S&P 500

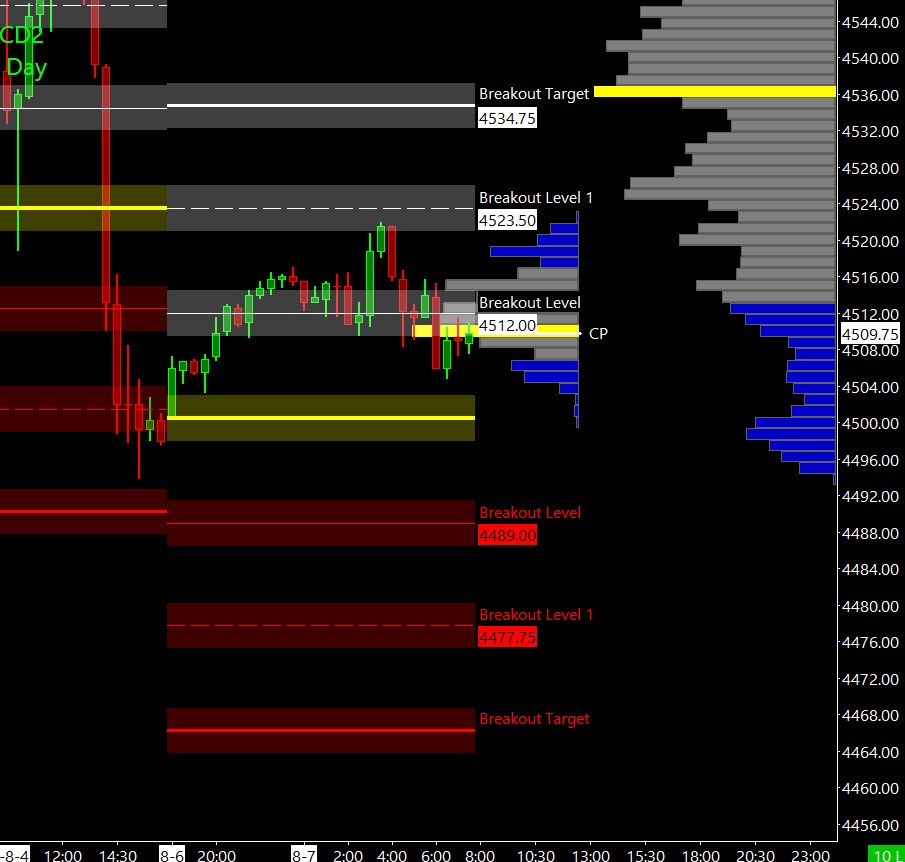
Prior Session was Cycle Day 1 (CD1): Normal CD1 as price declined, establishing a new cycle low at 4493.75. Prior range was 67 handles on 1.947M contracts exchanged.
…Transition from Cycle Day 1 to Cycle Day 2
This leads us into Cycle Day 2 (CD2): Price has retraced approximately 50% of prior session’s afternoon decline, back to prior GBX open zone. We’ll be anticipating a more normal CD2 “two-way” trade with core lean favoring sell-side as structural momentum has shifted over the past few sessions. As such, scenarios to consider for today’s trading.
Bull Scenario: Price sustains a bid above 4520 (VOL TRIG), initially targets 4530 – 4535 zone.
Bear Scenario: Price sustains an offer below 4520 (VOL TRIG), initially targets 4505 – 4500 zone.
PVA High Edge = 4541 PVA Low Edge = 4494 Prior POC = 4500
Range Projections and Key Levels (ES) Sept 2023 (U) Contract
HOD ATR Range Projection: 4548; LOD ATR Range Projection: 4475; 3 Day Central Pivot: 4532; 3 Day Cycle Target: 4553; 10 Day Average True Range 47; VIX: 17
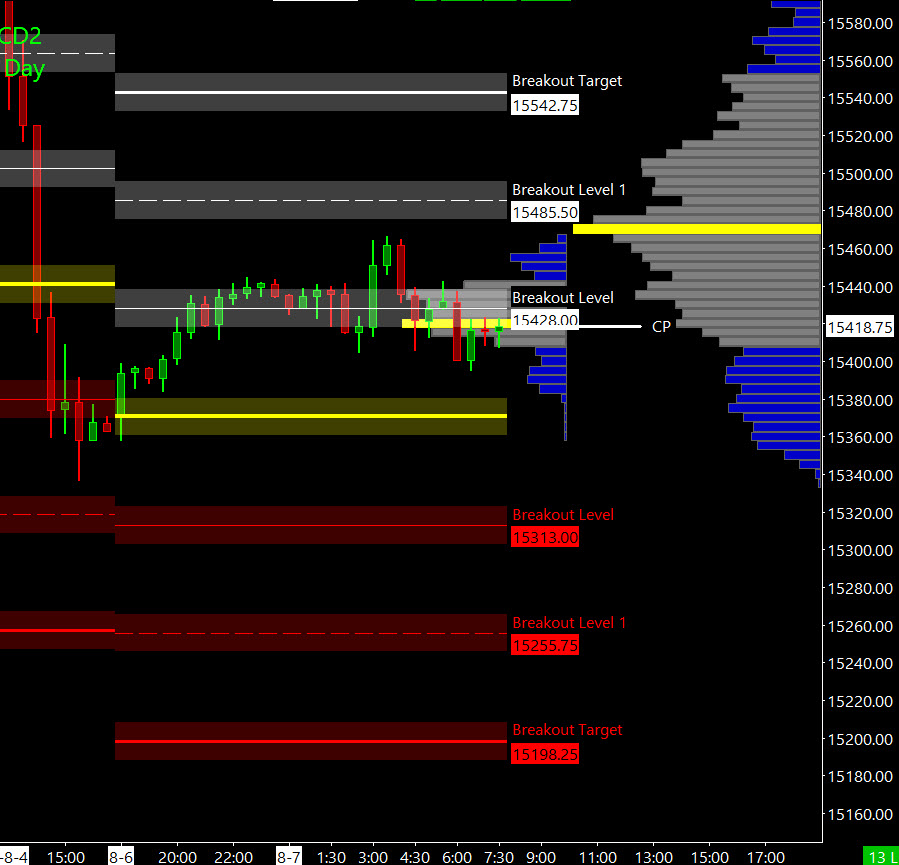
Nasdaq 100 (NQ)

Prior Session was Cycle Day 1 (CD1): Normal CD1 as price declined, establishing a new cycle low at 15336.50. Prior range was 273 handles on 761k contracts exchanged.
…Transition from Cycle Day 1 to Cycle Day 2
This leads us into Cycle Day 2 (CD2): Price has retraced approximately 50% of prior session’s afternoon decline, back to 5 day POC (15470). We’ll be anticipating a more normal CD2 “two-way” trade with core lean favoring sell-side as structural momentum has shifted over the past few sessions. As such, scenarios to consider for today’s trading.
Bull Scenario: Price sustains a bid above 15470 (5d POC), initially targets 15500 – 15525 zone.
Bear Scenario: Price sustains an offer below 15470 (5d POC), initially targets 15380 – 15370 zone.
PVA High Edge = 15577 PVA Low Edge = 15437 Prior POC = 15527
Range Projections and Key Levels (NQ) Sept 2023 (U) Contract
HOD ATR Range Projection: 15604; LOD ATR Range Projection: 15220; 3 Day Central Pivot: 15478; 3 Day Cycle Target: 15639; 10 Day Average True Range: 247; VIX: 17
Trade Strategy: Our tactical trade strategy will simply remain unaltered…We’ll be flexible to trade both long and short side from Decision Pivot Levels. Continue to focus on Bull/Bear Stackers and Premium/Discounts. As always, remaining in alignment with dominant intra-day force increases probabilities of producing winning trades.
Stay Focused…Non-Biased…Disciplined ALWAYS USE STOPS!
Good Trading…David
“Knowing is not enough, We must APPLY. Willing is not enough, We must DO.” –Bruce Lee
*****This trade strategy report is disseminated for “education only” and should not be viewed in any way as a recommendation to buy or sell futures products.”
PAST PERFORMANCE IS NOT NECESSARILY INDICATIVE OF FUTURE RESULTS
IMPORTANT NOTICE! No representation is being made that the use of this strategy or any system or trading methodology will generate profits. Past performance is not necessarily indicative of future results. There is substantial risk of loss associated with trading securities and options on equities. Only risk capital should be used to trade. Trading securities is not suitable for everyone.
Disclaimer: Futures, Options, and Currency trading all have large potential rewards, but they also have large potential risk. You must be aware of the risks and be willing to accept them in order to invest in these markets. Don’t trade with money you can’t afford to lose.
This website is neither a solicitation nor an offer to Buy/Sell futures, options, or currencies. No representation is being made that any account will or is likely to achieve profits or losses similar to those discussed on this web site. The past performance of any trading system or methodology is not necessarily indicative of future results.
CFTC RULE 4.41 –HYPOTHETICAL OR SIMULATED PERFORMANCE RESULTS HAVE CERTAIN LIMITATIONS. UNLIKE AN ACTUAL PERFORMANCE RECORD, SIMULATED RESULTS DO NOT REPRESENT ACTUAL TRADING. ALSO, SINCE THE TRADES HAVE NOT BEEN EXECUTED, THE RESULTS MAY HAVE UNDER-OR-OVER COMPENSATED FOR THE IMPACT, IF ANY, OF CERTAIN MARKET FACTORS, SUCH AS LACK OF LIQUIDITY. SIMULATED TRADING PROGRAMS IN GENERAL ARE ALSO SUBJECT TO THE FACT THAT THEY ARE DESIGNED WITH THE BENEFIT OF HINDSIGHT. NO REPRESENTATION IS BEING MADE THAT ANY ACCOUNT WILL OR IS LIKELY TO ACHIEVE PROFIT OR LOSSES SIMILAR TO THOSE SHOWN