
Markets

Last session of rollercoaster week
Closing higher yesterday after a wobbly session, U.S. equity futures dropped nearly 1% overnight, with the S&P 500 on course for a fourth consecutive week of losses.
Source: Seeking Alpha https://seekingalpha.com/
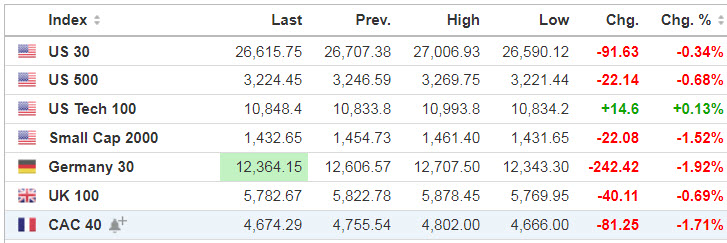
Source: https://www.investing.com/indices/indices-cfds
Economic Calendar
8:30 Durable Goods
9:00 Fed’s Williams Speech
1:00 PM Baker-Hughes Rig Count
Source: https://www.investing.com/economic-calendar/
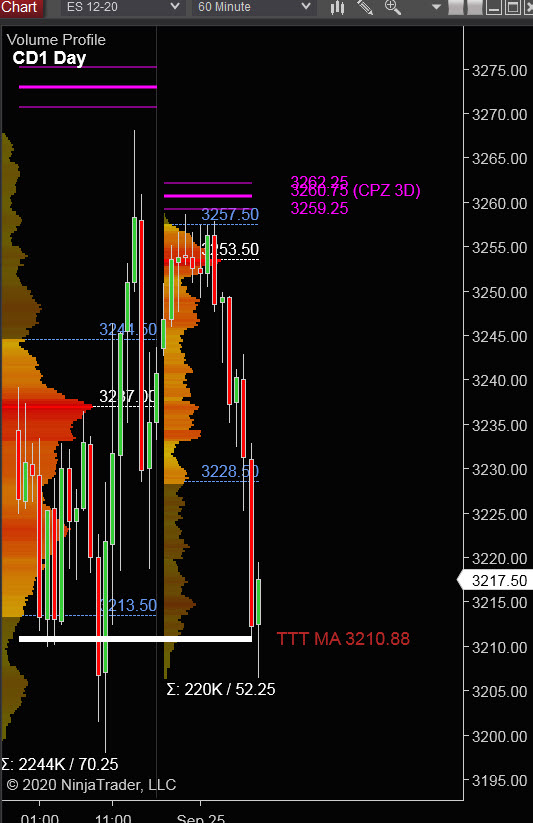
S&P 500 (ES)

Prior Session was Cycle Day 3 (CD3): Primary goal for CD3 was to recover the CD1 Low (3256.50) to produce a Positive 3 Day Rally Statistic. Though it took all day, price did achieve this objective, demonstrating the power of the 3 Day Cycle. Market on Close Sell Imbalance $1.5M capped the session. Range was 70.25 handles with 2.244M contracts exchanged.
…Transition from Cycle Day 3 to Cycle Day 1
This leads us into Cycle Day 1 (CD1): Price is trading lower pre-RTH already fulfilling Average Decline (3210) expected for CD1. End of the trading week volatility remains elevated for the foreseeable future. As such, there are two scenarios to consider for today’s trading.
1.) Price sustains a bid above 3210, initially targeting 3230 – 3245 zone.
2.) Price sustains an offer below 3210, initially targeting 3190 – 3174 zone.
P -VA High = 3244 P – VA Low = 3213 P – POC = 3237
Range Projections and Key Levels (ES) December 2020 (Z) Contract
HOD ATR Range Projection: 3270; LOD ATR Range Projection: 3195; 3 Day Central Pivot: 3260; 3 Day Cycle Target: 3290; 10 Day Average True Range 67; VIX: 30
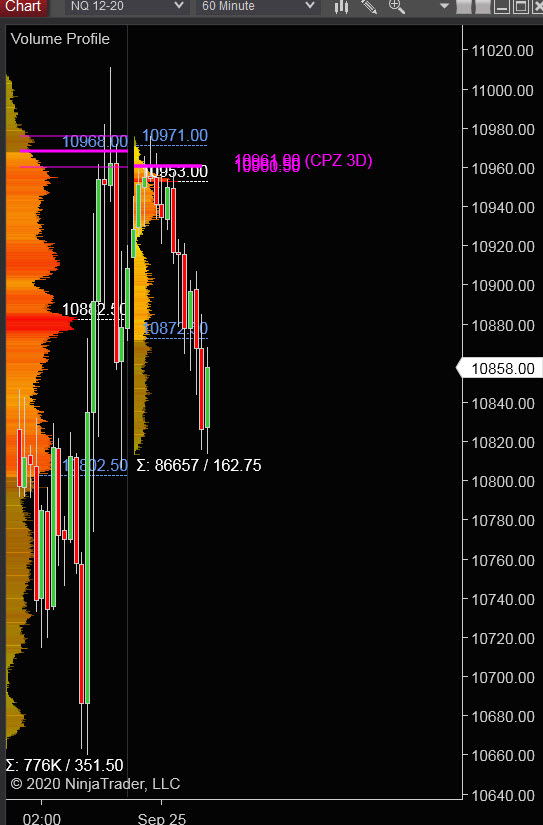
Nasdaq 100 (NQ)

Today is Cycle Day 1 (CD1)… Price is trading half-way back within prior value zone. Average Decline for CD1 measures 10715. As such, there are two scenarios to consider for today’s trading.
P – VA High = 10847 P – VA Low = 10714 P – POC = 10810
Bull Scenario: IF Bulls hold bid above 10875, THEN initial upside estimate targets 10915 – 10950 zone.
Bear Scenario: IF Bears hold offer below 10875, THEN initial downside estimate targets 10830 – 10800 zone.
Range Projections and Key Levels (NQ) December 2020 (Z) Contract
HOD ATR Range Projection: 10976; LOD ATR Range Projection: 10670; 3 Day Central Pivot: 10968; 3 Day Cycle Target: 11050; 10 Day Average True Range: 324; VIX: 30
Trade Strategy: Our tactical trade strategy will simply remain unaltered…We’ll be flexible to trade both long and short side from Decision Pivot Levels. Continue to focus on Bull/Bear Stackers and Premium/Discounts. As always, remaining in alignment with dominant intra-day force increases probabilities of producing winning trades.
Stay Focused…Non-Biased…Disciplined ALWAYS USE STOPS!
Good Trading…David
“Knowing is not enough, We must APPLY. Willing is not enough, We must DO.” –Bruce Lee
*****This trade strategy report is disseminated for “education only” and should not be viewed in any way as a recommendation to buy or sell futures products.”
PAST PERFORMANCE IS NOT NECESSARILY INDICATIVE OF FUTURE RESULTS
IMPORTANT NOTICE! No representation is being made that the use of this strategy or any system or trading methodology will generate profits. Past performance is not necessarily indicative of future results. There is substantial risk of loss associated with trading securities and options on equities. Only risk capital should be used to trade. Trading securities is not suitable for everyone.
Disclaimer: Futures, Options, and Currency trading all have large potential rewards, but they also have large potential risk. You must be aware of the risks and be willing to accept them in order to invest in these markets. Don’t trade with money you can’t afford to lose.
This website is neither a solicitation nor an offer to Buy/Sell futures, options, or currencies. No representation is being made that any account will or is likely to achieve profits or losses similar to those discussed on this web site. The past performance of any trading system or methodology is not necessarily indicative of future results.
CFTC RULE 4.41 –HYPOTHETICAL OR SIMULATED PERFORMANCE RESULTS HAVE CERTAIN LIMITATIONS. UNLIKE AN ACTUAL PERFORMANCE RECORD, SIMULATED RESULTS DO NOT REPRESENT ACTUAL TRADING. ALSO, SINCE THE TRADES HAVE NOT BEEN EXECUTED, THE RESULTS MAY HAVE UNDER-OR-OVER COMPENSATED FOR THE IMPACT, IF ANY, OF CERTAIN MARKET FACTORS, SUCH AS LACK OF LIQUIDITY. SIMULATED TRADING PROGRAMS IN GENERAL ARE ALSO SUBJECT TO THE FACT THAT THEY ARE DESIGNED WITH THE BENEFIT OF HINDSIGHT. NO REPRESENTATION IS BEING MADE THAT ANY ACCOUNT WILL OR IS LIKELY TO ACHIEVE PROFIT OR LOSSES SIMILAR TO THOSE SHOWN