
Markets
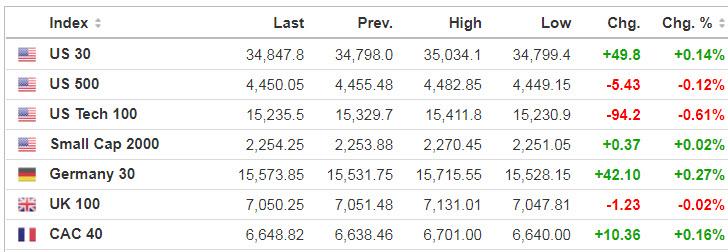
The S&P 500 (SP500) snapped a two-week losing streak last week. And while Treasury yields have been rising, that’s been more to do with the response to global central banks looking to remove accommodation.
The deadline in the debt ceiling showdown in Washington approaches, with a government shutdown possible on Friday, Oct. 1.
Source: SeekingAlpha.com
Economic Calendar
8:30 Durable Goods
10:30 Dallas Fed Manufacturing Survey
11:30 Results of $60B, 2-Year Note Auction
1:00 PM Results of $61B, 5-Year Note Auction
https://www.investing.com/economic-calendar/
***New: PTG Trading Room Chat Log’s Link
S&P 500

Friday’s Session was Cycle Day 1 (CD1): Price declined first, establishing the CD1 Low (4410.75), setting up a classic rally throughout the RTH. Range was 42 handles on 1.088M contracts exchanged.
…Transition from Cycle Day 1 to Cycle Day 2
This leads us into Cycle Day 2 (CD2): Normal for CD2 is for consolidation of recent gains from prior cycle. Overnight activity has price trading back into prior value area, near 5-day POC (4440). As such, estimated scenarios to consider for today’s trading.
1.) Price sustains a bid above 4440, initially targets 4450 – 4455 zone.
2.) Price sustains an offer below 4440, initially targets 4430 – 4425 zone.
*****The 3 Day Cycle has a 91% probability of fulfilling Positive Cycle Statistics covering 12 years of recorded tracking history.
PVA High Edge = 4446 PVA Low Edge = 4428 Prior POC = 4440
Range Projections and Key Levels (ES) December 2021 (Z) Contract
HOD ATR Range Projection: 4496; LOD ATR Range Projection: 4413; 3 Day Central Pivot: 4412; 3 Day Cycle Target: 4461; 10 Day Average True Range 59; VIX: 18

Nasdaq 100 (NQ)

Today is Cycle Day 2 (CD2)…Price is trading back into prior value area, near 5-day POC (15230) during overnight activity. Prior range was 157 handles on 454k contracts exchanged. As such, there are two estimated scenarios to consider for today’s trading.
PVA High Edge = 15270 PVA Low Edge = 15187 Prior POC = 15231
Bull Scenario: IF Bulls sustain a bid above 15230, THEN initial upside estimate targets 15270 – 15280 zone.
Bear Scenario: IF Bears sustain an offer below 15230, THEN initial downside estimate targets 15205 – 14185 zone.
Range Projections and Key Levels (NQ) December 2021 (Z) Contract
HOD ATR Range Projection: 15438; LOD ATR Range Projection: 14176; 3 Day Central Pivot: 15220; 3 Day Cycle Target: 15386; 10 Day Average True Range: 222; VIX: 18

Trade Strategy: Our tactical trade strategy will simply remain unaltered…We’ll be flexible to trade both long and short side from Decision Pivot Levels. Continue to focus on Bull/Bear Stackers and Premium/Discounts. As always, remaining in alignment with dominant intra-day force increases probabilities of producing winning trades.
Stay Focused…Non-Biased…Disciplined ALWAYS USE STOPS!
Good Trading…David
“Knowing is not enough, We must APPLY. Willing is not enough, We must DO.” –Bruce Lee
*****This trade strategy report is disseminated for “education only” and should not be viewed in any way as a recommendation to buy or sell futures products.”
PAST PERFORMANCE IS NOT NECESSARILY INDICATIVE OF FUTURE RESULTS
IMPORTANT NOTICE! No representation is being made that the use of this strategy or any system or trading methodology will generate profits. Past performance is not necessarily indicative of future results. There is substantial risk of loss associated with trading securities and options on equities. Only risk capital should be used to trade. Trading securities is not suitable for everyone.
Disclaimer: Futures, Options, and Currency trading all have large potential rewards, but they also have large potential risk. You must be aware of the risks and be willing to accept them in order to invest in these markets. Don’t trade with money you can’t afford to lose.
This website is neither a solicitation nor an offer to Buy/Sell futures, options, or currencies. No representation is being made that any account will or is likely to achieve profits or losses similar to those discussed on this web site. The past performance of any trading system or methodology is not necessarily indicative of future results.
CFTC RULE 4.41 –HYPOTHETICAL OR SIMULATED PERFORMANCE RESULTS HAVE CERTAIN LIMITATIONS. UNLIKE AN ACTUAL PERFORMANCE RECORD, SIMULATED RESULTS DO NOT REPRESENT ACTUAL TRADING. ALSO, SINCE THE TRADES HAVE NOT BEEN EXECUTED, THE RESULTS MAY HAVE UNDER-OR-OVER COMPENSATED FOR THE IMPACT, IF ANY, OF CERTAIN MARKET FACTORS, SUCH AS LACK OF LIQUIDITY. SIMULATED TRADING PROGRAMS IN GENERAL ARE ALSO SUBJECT TO THE FACT THAT THEY ARE DESIGNED WITH THE BENEFIT OF HINDSIGHT. NO REPRESENTATION IS BEING MADE THAT ANY ACCOUNT WILL OR IS LIKELY TO ACHIEVE PROFIT OR LOSSES SIMILAR TO THOSE SHOWN