
Markets
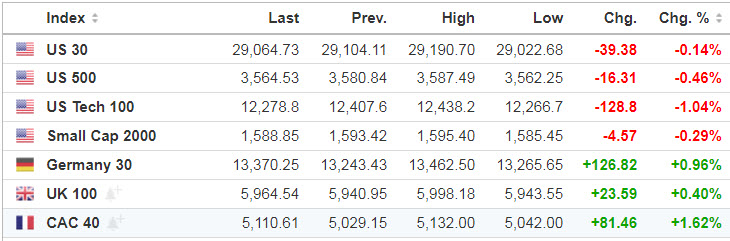
Traders look set to pare the robust gains seen on Wall Street this week after a rally that lifted the DJIA above 29,000 for the first time since February.
Source: SeekingAlpha.com
Economic Calendar
8:30 Jobless Claims
8:30 Goods and Services Trade
8:30 Productivity and Costs
9:45 PMI Composite Final
10:00 ISM Service Index
10:30 EIA Natural Gas Inventory

On the economic calendar, reports today include the latest jobless claims, July’s trade balance, revisions to Q2 productivity and labor costs, and the ISM’s non-manufacturing PMI for August.
https://www.investing.com/economic-calendar/
***New: PTG Trading Room Chat Log’s Link
S&P 500
Prior Session was Cycle Day 2 (CD2): Early normal CD2 consolidation lead to explosive rally, pushing price yet again to a new all-time high. Range was 60.75 handles, double the 10-day average of 30, with 1.178M contracts exchanged.
…Transition from Cycle Day 2 to Cycle Day 3
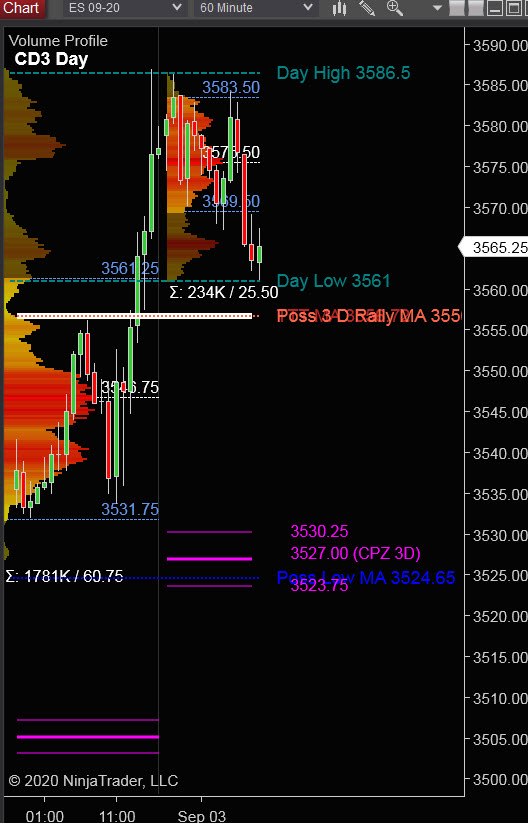
This leads us into Cycle Day 3 (CD3): Price has exceeded this cycle’s most bullish projections and is pulling back during overnight trade. Price is still above prior value zone and as such , there are two scenarios to consider for today’s trading.
1.) Price sustains a bid above 3560, initially targeting 3570 – 3575 zone.
2.) Price sustains an offer below 3560, initially targeting 3550 – 3540 zone.
*****3 Day Cycle has a 91% probability of fulfilling Positive Statistic covering 12 years of recorded tracking history.
PVA High Edge = 3560 PVA Low Edge = 3547 Prior POC = 3532
Range Projections and Key Levels (ES) September 2020 (U) Contract
HOD ATR Range Projection: 3556; LOD ATR Range Projection: 3557; 3 Day Central Pivot: 3527; 3 Day Cycle Target: 3556; 10 Day Average True Range 30; VIX: 26
Nasdaq 100 (NQ)
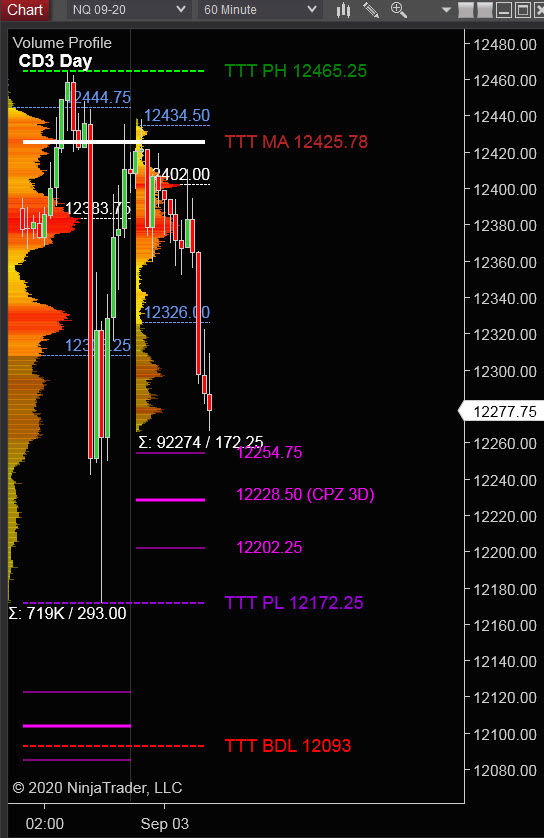
Today is Cycle Day 3 (CD3)…Price is trading back within prior value zone during overnight trade and as such, there are two scenarios to consider for today’s trading:
PVA High Edge = 12445 PVA Low Edge = 12306 Prior POC = 12382
Bull Scenario: IF Bulls sustain a bid above 12330, THEN initial upside estimate targets 12380 – 12400 zone.
Bear Scenario: IF Bears sustain an offer below 12330, THEN initial downside estimate targets 12280 – 12250 zone.
Range Projections and Key Levels (NQ) September 2020 (U) Contract
HOD ATR Range Projection: 12350; LOD ATR Range Projection: 12288; 3 Day Central Pivot: 12228; 3 Day Cycle Target: 12425; 10 Day Average True Range: 177; VIX: 26
Trade Strategy: Our tactical trade strategy will simply remain unaltered…We’ll be flexible to trade both long and short side from Decision Pivot Levels. Continue to focus on Bull/Bear Stackers and Premium/Discounts. As always, remaining in alignment with dominant intra-day force increases probabilities of producing winning trades.
Stay Focused…Non-Biased…Disciplined ALWAYS USE STOPS!
Good Trading…David
“Knowing is not enough, We must APPLY. Willing is not enough, We must DO.” –Bruce Lee
*****This trade strategy report is disseminated for “education only” and should not be viewed in any way as a recommendation to buy or sell futures products.”
PAST PERFORMANCE IS NOT NECESSARILY INDICATIVE OF FUTURE RESULTS
IMPORTANT NOTICE! No representation is being made that the use of this strategy or any system or trading methodology will generate profits. Past performance is not necessarily indicative of future results. There is substantial risk of loss associated with trading securities and options on equities. Only risk capital should be used to trade. Trading securities is not suitable for everyone.
Disclaimer: Futures, Options, and Currency trading all have large potential rewards, but they also have large potential risk. You must be aware of the risks and be willing to accept them in order to invest in these markets. Don’t trade with money you can’t afford to lose.
This website is neither a solicitation nor an offer to Buy/Sell futures, options, or currencies. No representation is being made that any account will or is likely to achieve profits or losses similar to those discussed on this web site. The past performance of any trading system or methodology is not necessarily indicative of future results.
CFTC RULE 4.41 –HYPOTHETICAL OR SIMULATED PERFORMANCE RESULTS HAVE CERTAIN LIMITATIONS. UNLIKE AN ACTUAL PERFORMANCE RECORD, SIMULATED RESULTS DO NOT REPRESENT ACTUAL TRADING. ALSO, SINCE THE TRADES HAVE NOT BEEN EXECUTED, THE RESULTS MAY HAVE UNDER-OR-OVER COMPENSATED FOR THE IMPACT, IF ANY, OF CERTAIN MARKET FACTORS, SUCH AS LACK OF LIQUIDITY. SIMULATED TRADING PROGRAMS IN GENERAL ARE ALSO SUBJECT TO THE FACT THAT THEY ARE DESIGNED WITH THE BENEFIT OF HINDSIGHT. NO REPRESENTATION IS BEING MADE THAT ANY ACCOUNT WILL OR IS LIKELY TO ACHIEVE PROFIT OR LOSSES SIMILAR TO THOSE SHOWN