
Markets

Wall Street now appears to be regaining some footing, with Nasdaq futures ahead by nearly 2%, and contracts tied to the Dow and S&P 500 up 0.6% and 0.8%, respectively.
Source: Seeking Alpha https://seekingalpha.com/
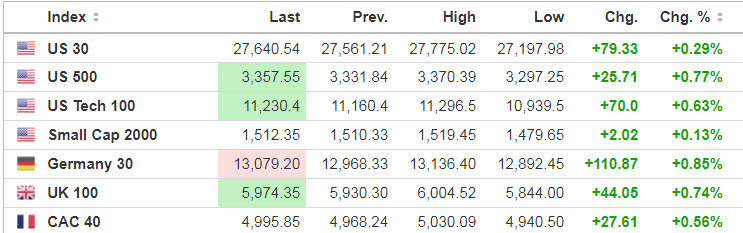
Source: https://www.investing.com/indices/indices-cfds
Economic Calendar
10:00 Job Openings and Labor Turnover Survey
1:00 PM Results of $35B, 10-Year Note Auction
Source: https://www.investing.com/economic-calendar/
S&P 500 (ES)
***Written 8 pm Tuesday evening for Wednesday’s trading
Tuesday’s Session was Cycle Day 3 (CD3): In previous week’s DTS Briefing Report 9.2.20 we were talking about “Buy the Dip” being the trade strategy. One week later, it’s a much different market…”Tech Wreck” and “Sell the Bounce” are the new buzz phrases.
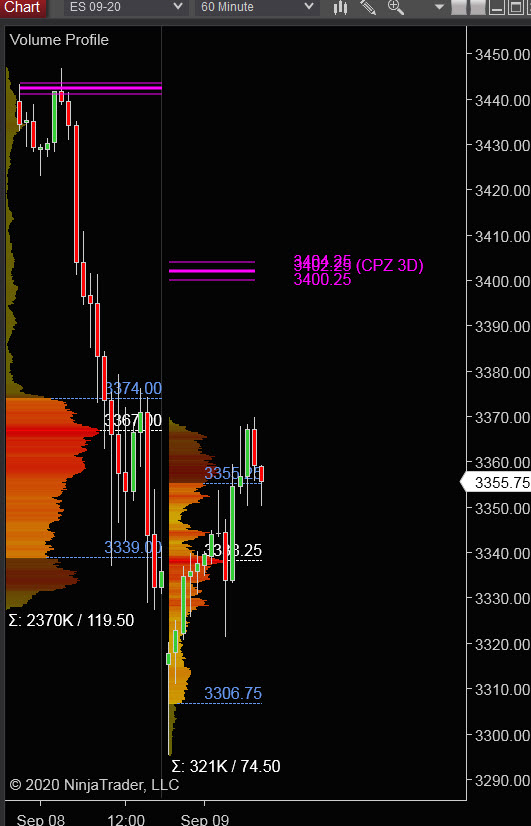
Price failed to clear 3440 handle, a bearish shifted 3 Day Central Pivot Zone, which is PTG’s proxy for trend direction. Value has also shifted to bearish configuration (i.e. Lower VAH and Lower VAL). Previous session range was 119.50 handles, twice the 10-day average of 54, with 2.370M contracts exchanged.
…Transition from Cycle Day 3 to Cycle Day 1
This leads us into Cycle Day 1 (CD1): Price is below the prior low (3328) and well past the Average Decline for CD1. As such, there are two scenarios to consider for today’s trading.
1.) Price sustains a bid above 3328, initially targeting 3355 – 3365 zone.
2.) Price sustains an offer below 3328, initially targeting 3295 – 3282 zone.
P -VA High = 3374 P – VA Low = 3339 P – POC = 3367
Range Projections and Key Levels (ES) September 2020 (U) Contract
HOD ATR Range Projection: 3381; LOD ATR Range Projection: 3393; 3 Day Central Pivot: 3402; 10 Day Average True Range 54; VIX: 31
Nasdaq 100 (NQ)
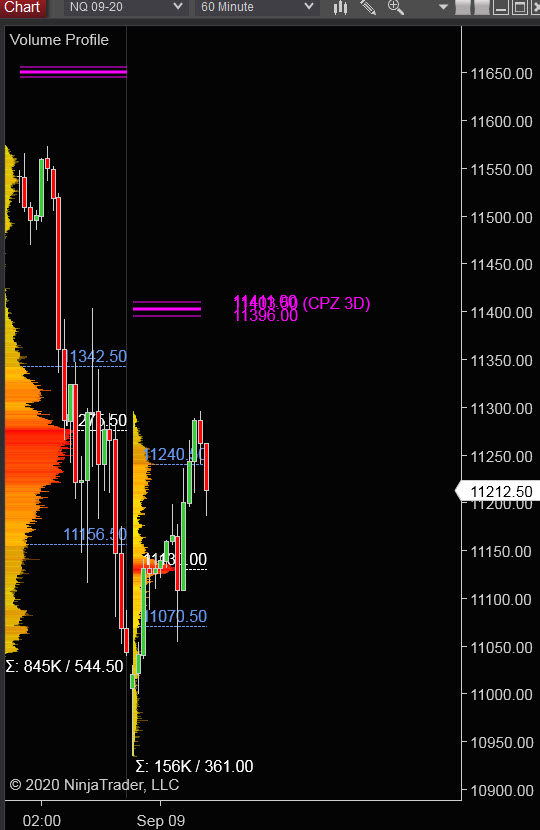
Today is Cycle Day 1 (CD1)… Price has rallied back into prior value range and currently trading near Point of Control (11275). As such, there are two scenarios to consider for today’s trading.
P – VA High = 11342 P – VA Low = 11156 P – POC = 11275
Bull Scenario: IF Bulls hold bid above 11275, THEN initial upside estimate targets 11342 – 11396 zone.
Bear Scenario: IF Bears hold offer below 11275, THEN initial downside estimate targets 11156 – 11070 zone.
Range Projections and Key Levels (NQ) September 2020 (U) Contract
HOD ATR Range Projection: 11350; LOD ATR Range Projection: 11287; 3 Day Central Pivot: 11396; 10 Day Average True Range: 298; VIX: 31
Trade Strategy: Our tactical trade strategy will simply remain unaltered…We’ll be flexible to trade both long and short side from Decision Pivot Levels. Continue to focus on Bull/Bear Stackers and Premium/Discounts. As always, remaining in alignment with dominant intra-day force increases probabilities of producing winning trades.
Stay Focused…Non-Biased…Disciplined ALWAYS USE STOPS!
Good Trading…David
“Knowing is not enough, We must APPLY. Willing is not enough, We must DO.” –Bruce Lee
*****This trade strategy report is disseminated for “education only” and should not be viewed in any way as a recommendation to buy or sell futures products.”
PAST PERFORMANCE IS NOT NECESSARILY INDICATIVE OF FUTURE RESULTS
IMPORTANT NOTICE! No representation is being made that the use of this strategy or any system or trading methodology will generate profits. Past performance is not necessarily indicative of future results. There is substantial risk of loss associated with trading securities and options on equities. Only risk capital should be used to trade. Trading securities is not suitable for everyone.
Disclaimer: Futures, Options, and Currency trading all have large potential rewards, but they also have large potential risk. You must be aware of the risks and be willing to accept them in order to invest in these markets. Don’t trade with money you can’t afford to lose.
This website is neither a solicitation nor an offer to Buy/Sell futures, options, or currencies. No representation is being made that any account will or is likely to achieve profits or losses similar to those discussed on this web site. The past performance of any trading system or methodology is not necessarily indicative of future results.
CFTC RULE 4.41 –HYPOTHETICAL OR SIMULATED PERFORMANCE RESULTS HAVE CERTAIN LIMITATIONS. UNLIKE AN ACTUAL PERFORMANCE RECORD, SIMULATED RESULTS DO NOT REPRESENT ACTUAL TRADING. ALSO, SINCE THE TRADES HAVE NOT BEEN EXECUTED, THE RESULTS MAY HAVE UNDER-OR-OVER COMPENSATED FOR THE IMPACT, IF ANY, OF CERTAIN MARKET FACTORS, SUCH AS LACK OF LIQUIDITY. SIMULATED TRADING PROGRAMS IN GENERAL ARE ALSO SUBJECT TO THE FACT THAT THEY ARE DESIGNED WITH THE BENEFIT OF HINDSIGHT. NO REPRESENTATION IS BEING MADE THAT ANY ACCOUNT WILL OR IS LIKELY TO ACHIEVE PROFIT OR LOSSES SIMILAR TO THOSE SHOWN