
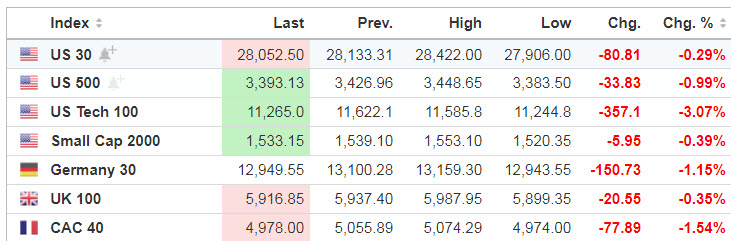
Markets

Heavy losses for tech The tech carnage looks set to continue this morning after Nasdaq 100 futures reversed to trade more than 2% lower amid escalating doubts over positioning (the index plunged 6% over Thursday and Friday). Contracts tied to the Dow are flat and S&P 500 futures are off 0.6% as traders return to their screens following the extended holiday weekend.
Source: SeekingAlpha.com
Economic Calendar
1:00 PM Results of $50B, 3-Year Note Auction
3:00 PM Consumer Credit
https://www.investing.com/economic-calendar/
***New: PTG Trading Room Chat Log’s Link
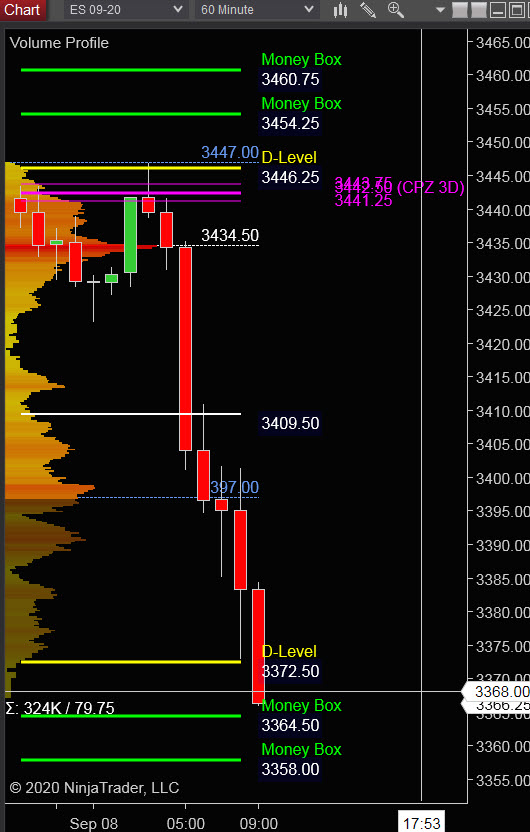
S&P 500
Prior Session was Cycle Day 2 (CD2): Shortend holiday trade pushed price a bit higher but has relinquished their gains during overnight trade. Range was 58.75 handles, with 258k contracts exchanged.
…Transition from Cycle Day 2 to Cycle Day 3
This leads us into Cycle Day 3 (CD3): Price is extending losses pre-RTH testing previous low (3382.75). Positive 3-day cycle statistic has been fulfilled. Price is still within 2-day value zone and as such, there are two scenarios to consider for today’s trading.
1.) Price sustains a bid above 3382, initially targeting 3400 – 3415 zone.
2.) Price sustains an offer below 3382, initially targeting 3350 – 3348 zone.
*****3 Day Cycle has a 91% probability of fulfilling Positive Statistic covering 12 years of recorded tracking history.
PVA High Edge = 3400 PVA Low Edge = 3424 Prior POC = 3413
Range Projections and Key Levels (ES) September 2020 (U) Contract
HOD ATR Range Projection: 3392; LOD ATR Range Projection: 3340; 3 Day Central Pivot: 3442; 3 Day Cycle Target: 3420; 10 Day Average True Range 45; VIX: 35
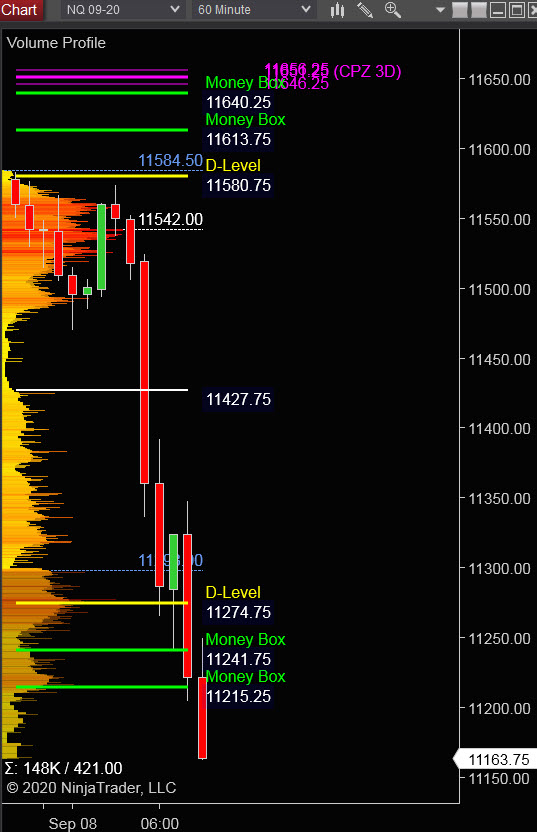
Nasdaq 100 (NQ)
Today is Cycle Day 3 (CD3)…Price is continuing its decline closing in on CD1 Low (11142) retest. Positive 3 day cycle statistic has been fulfilled and as such, there are two scenarios to consider for today’s trading:
PVA High Edge = 11404 PVA Low Edge = 11488 Prior POC = 11458
Bull Scenario: IF Bulls sustain a bid above 11300, THEN initial upside estimate targets 11350 – 11370 zone.
Bear Scenario: IF Bears sustain an offer below 11300, THEN initial downside estimate targets 11200 – 11150 zone.
Range Projections and Key Levels (NQ) September 2020 (U) Contract
HOD ATR Range Projection: 11384; LOD ATR Range Projection: 11601; 3 Day Central Pivot: 11650; 3 Day Cycle Target: 11477; 10 Day Average True Range: 242; VIX: 35
Trade Strategy: Our tactical trade strategy will simply remain unaltered…We’ll be flexible to trade both long and short side from Decision Pivot Levels. Continue to focus on Bull/Bear Stackers and Premium/Discounts. As always, remaining in alignment with dominant intra-day force increases probabilities of producing winning trades.
Stay Focused…Non-Biased…Disciplined ALWAYS USE STOPS!
Good Trading…David
“Knowing is not enough, We must APPLY. Willing is not enough, We must DO.” –Bruce Lee
*****This trade strategy report is disseminated for “education only” and should not be viewed in any way as a recommendation to buy or sell futures products.”
PAST PERFORMANCE IS NOT NECESSARILY INDICATIVE OF FUTURE RESULTS
IMPORTANT NOTICE! No representation is being made that the use of this strategy or any system or trading methodology will generate profits. Past performance is not necessarily indicative of future results. There is substantial risk of loss associated with trading securities and options on equities. Only risk capital should be used to trade. Trading securities is not suitable for everyone.
Disclaimer: Futures, Options, and Currency trading all have large potential rewards, but they also have large potential risk. You must be aware of the risks and be willing to accept them in order to invest in these markets. Don’t trade with money you can’t afford to lose.
This website is neither a solicitation nor an offer to Buy/Sell futures, options, or currencies. No representation is being made that any account will or is likely to achieve profits or losses similar to those discussed on this web site. The past performance of any trading system or methodology is not necessarily indicative of future results.
CFTC RULE 4.41 –HYPOTHETICAL OR SIMULATED PERFORMANCE RESULTS HAVE CERTAIN LIMITATIONS. UNLIKE AN ACTUAL PERFORMANCE RECORD, SIMULATED RESULTS DO NOT REPRESENT ACTUAL TRADING. ALSO, SINCE THE TRADES HAVE NOT BEEN EXECUTED, THE RESULTS MAY HAVE UNDER-OR-OVER COMPENSATED FOR THE IMPACT, IF ANY, OF CERTAIN MARKET FACTORS, SUCH AS LACK OF LIQUIDITY. SIMULATED TRADING PROGRAMS IN GENERAL ARE ALSO SUBJECT TO THE FACT THAT THEY ARE DESIGNED WITH THE BENEFIT OF HINDSIGHT. NO REPRESENTATION IS BEING MADE THAT ANY ACCOUNT WILL OR IS LIKELY TO ACHIEVE PROFIT OR LOSSES SIMILAR TO THOSE SHOWN