
Markets
Will the global equity selloff extend for another day? That’s the question traders are asking this morning as U.S. futures hovered between significant gains and losses overnight (they’re currently up by 0.2%-0.5%).
Nearly 6.3% and an estimated $1.7T in value has been wiped off the S&P 500 over the last two days as the CDC warned the coronavirus is “likely” to spread across the U.S. amid increasing deaths and confirmed cases outside of China.
While analysts and policymakers are finding it hard to quantify the economic impact of the virus, many are pricing in a slowdown in world growth, though it’s still unclear how far that will extend.
In Asia, Japan -0.8%. Hong Kong -0.7%. China -0.8%. India -1%.
In Europe, at midday, London -0.8%. Paris -1.2%. Frankfurt -1.6%.
Futures at 6:20, Dow +0.2%. S&P +0.3%. Nasdaq +0.5%. Crude -1.2% to $49.30. Gold +0.1% to $1650.90. Bitcoin -3.9% to $9165.
Ten-year Treasury Yield +3 bps to 1.36%
Source: Seeking Alpha https://seekingalpha.com/
Economic Calendar
10:00 New Home Sales
10:00 State Street Investor Confidence Index
10:30 EIA Petroleum Inventories
11:00 Survey of Business Uncertainty
11:30 Results of $18B, 2-Year FRN Auction
1:00 PM Results of $41B, 5-Year Note Auction
https://www.investing.com/economic-calendar/
***New: PTG Trading Room Chat Log’s Link
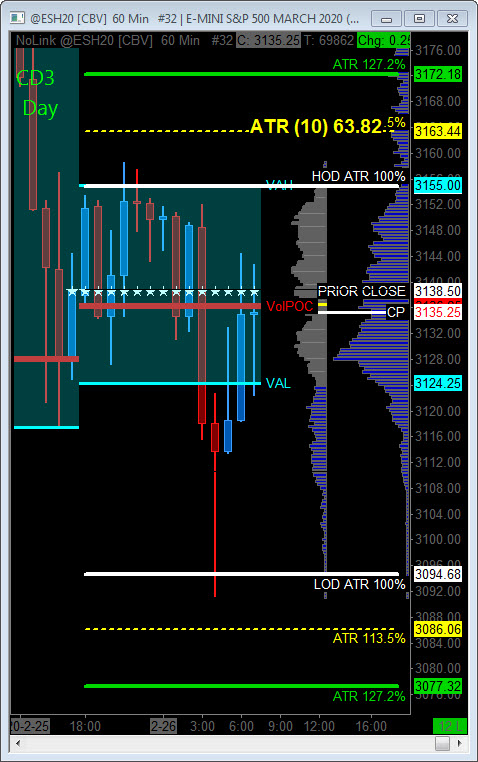
S&P 500
Prior Session was Cycle Day 2 (CD2)…Past few session’s price declines have been historic and one for the record books. Decline on CD2 easily exceeded 10 years of recorded extremes since we began publishing 3 Day Cycle Report.
Posted in the Trade Room; “PTGDavid :(2:26:39 PM) : I’m thinking 3118 – 3120 might be interesting zone for Long probe” Turned out LOD was 3117.25. When price hit 8 Sigma Extremes you “gotta buy’em!” Price quickly rallied 20 handles before settling back to close 10 handles off lows.
This leads us into today’s Cycle Day 3 (CD1)… Overnight trade action has price action in more of “stabilization-mode”. Price is well below Cycle Day 1 Low (3213.75) and MUST RECOVER to fulfill Positive Cycle Statistic.
Given prior cycle failed and increased likelihood of second failure, typically this has signaled beginning of corrective market phase. Time will tell all!
ATR Range High = 3155.00 ATR Range Low = 3095.00 CD3 Range Avg = 31.75
Bull Scenario: IF Bulls hold bid above 3138, THEN initial upside estimate targets 3155 – 3172 zone.
Bear Scenario: IF Bears hold offer below 3138, THEN initial downside estimate targets 3105 – 3095 zone.
Range Projections and Key Levels (ES) March 2020 (H) Contract
HOD ATR Range Projection: 3155.00; LOD ATR Range Projection: 3095.00; 3 Day Central Pivot: 3256.00; 3 Day Cycle Target: 3243.00; 10 Day Average True Range 63.82; VIX: 26.85
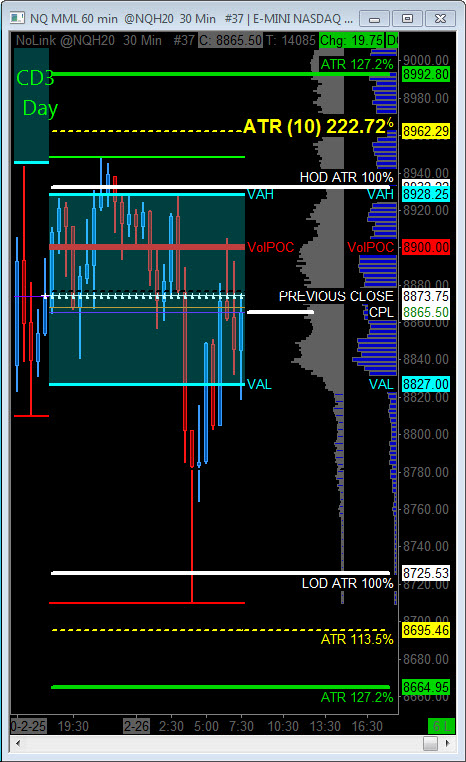
Nasdaq 100 (NQ)
Today is Cycle Day 3 (CD3)…Overnight trade has price seeking stabilization within the 10-day Average True Range between 8936 — 8726 boundaries. Price must recover CD1 Low (9041.25) otherwise Cycle will mark it’s second consecutive failure which historically has been a bearish signal for the markets
ATR Range High = 8936.00 ATR Range Low = 8726.00 CD3 Range Avg = 118.00
Bull Scenario: IF Bulls hold bid above 8900, THEN initial upside estimate targets 8936 – 8992 zone.
Bear Scenario: IF Bears hold offer below 8900, THEN initial downside estimate targets 8752 – 8725 zone.
Range Projections and Key Levels (NQ) March 2020 (H) Contract
HOD ATR Range Projection: 8936.00; LOD ATR Range Projection: 8726.00; 3 Day Central Pivot: 9211.00; 3 Day Cycle Target: 9115.00; 10 Day Average True Range: 223.00; VIX: 26.85
Trade Strategy: Our tactical trade strategy will simply remain unaltered…We’ll be flexible to trade both long and short side from Decision Pivot Levels. Continue to focus on Bull/Bear Stackers and Premium/Discounts. As always, remaining in alignment with dominant intra-day force increases probabilities of producing winning trades.
Stay Focused…Non-Biased…Disciplined ALWAYS USE STOPS!
Good Trading…David
“Knowing is not enough, We must APPLY. Willing is not enough, We must DO.” –Bruce Lee
*****This trade strategy report is disseminated for “education only” and should not be viewed in any way as a recommendation to buy or sell futures products.”
PAST PERFORMANCE IS NOT NECESSARILY INDICATIVE OF FUTURE RESULTS
IMPORTANT NOTICE! No representation is being made that the use of this strategy or any system or trading methodology will generate profits. Past performance is not necessarily indicative of future results. There is substantial risk of loss associated with trading securities and options on equities. Only risk capital should be used to trade. Trading securities is not suitable for everyone.
Disclaimer: Futures, Options, and Currency trading all have large potential rewards, but they also have large potential risk. You must be aware of the risks and be willing to accept them in order to invest in these markets. Don’t trade with money you can’t afford to lose.
This website is neither a solicitation nor an offer to Buy/Sell futures, options, or currencies. No representation is being made that any account will or is likely to achieve profits or losses similar to those discussed on this web site. The past performance of any trading system or methodology is not necessarily indicative of future results.
CFTC RULE 4.41 –HYPOTHETICAL OR SIMULATED PERFORMANCE RESULTS HAVE CERTAIN LIMITATIONS. UNLIKE AN ACTUAL PERFORMANCE RECORD, SIMULATED RESULTS DO NOT REPRESENT ACTUAL TRADING. ALSO, SINCE THE TRADES HAVE NOT BEEN EXECUTED, THE RESULTS MAY HAVE UNDER-OR-OVER COMPENSATED FOR THE IMPACT, IF ANY, OF CERTAIN MARKET FACTORS, SUCH AS LACK OF LIQUIDITY. SIMULATED TRADING PROGRAMS IN GENERAL ARE ALSO SUBJECT TO THE FACT THAT THEY ARE DESIGNED WITH THE BENEFIT OF HINDSIGHT. NO REPRESENTATION IS BEING MADE THAT ANY ACCOUNT WILL OR IS LIKELY TO ACHIEVE PROFIT OR LOSSES SIMILAR TO THOSE SHOWN