
Markets

Traders widely expect the Federal Reserve to slow its pace of rate hikes to 25 basis points today, down from a 50 bps increase in December, which followed four back-to-back 75 bps hikes. It follows recent economic data that showed inflation decelerating over the past few months, giving evidence that rate hikes are starting to work. On Friday, core PCE inflation, the Fed’s preferred measure, came in at 4.4% Y/Y for December, though the overall figure still remains well above the central bank’s 2% goal.
Snapshot: The Fed’s rapid tightening, which started in March 2022, was intended to reduce demand for goods and services, and bring it more into balance with supply to ease inflationary pressures. Jay Powell and Co. are now assessing the impact of the tightening already in place, so keep a close eye on his press conference that starts at 2:30 PM ET. Of particular note will be whether the statement of “ongoing [interest rate] increases” will be included (it has been in every FOMC statement since last March).
Many recent remarks from Fed officials expect the terminal rate to exceed 5%, with none indicating a willingness to cut for the rest of the year. The Seeking Alpha community appears to agree, with 64% of respondents to this week’s Wall Street Breakfast survey believing that rates will hit 5% or more in 2023. Earlier in January, Minneapolis Fed President Neel Kashkari even said he sees the federal funds rate rising to 5.4% before pausing.
Source: SeekingAlpha.com
Economic Calendar
8:15 ADP Jobs Report
9:45 PMI Manufacturing Index
10:00 ISM Manufacturing Index
10:00 Construction Spending
10:00 Job Openings and Labor Turnover Survey
10:30 EIA Petroleum Inventories
2:00 PM FOMC Announcement
2:30 PM Chairman Press Conference
https://www.investing.com/economic-calendar/


S&P 500

***Written Tuesday evening for Wednesday’s trading for contribution to MrTopStep’s “The Opening Print” publication.
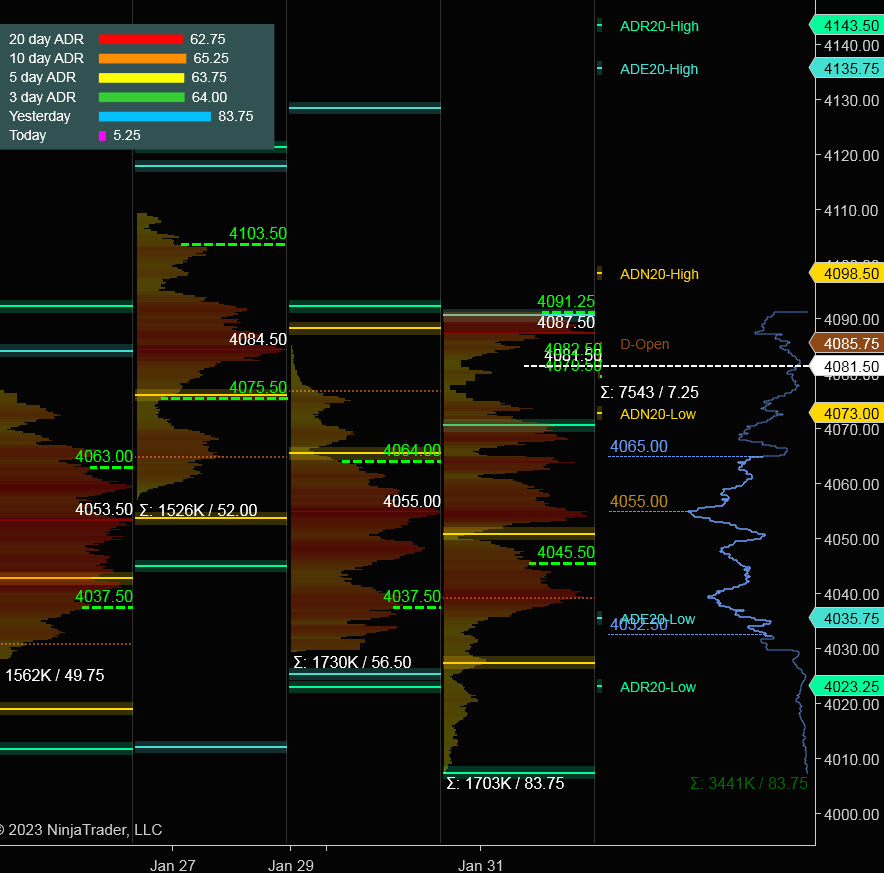
Prior Session was Cycle Day 1 (CD1): Normal CD1 as price declined establishing a new cycle low at 4007.50, which matched closely with projected range low (4015) and TargetMaster Zone (4012 – 4006). Prior range was 84 handles on 1.703M contracts exchanged.
…Transition from Cycle Day 1 to Cycle Day 2
This leads us into Cycle Day 2 (CD2): Price has rallied to upper target 4090 during prior session. Normal for CD2 is for some consolidation to work off prior rally. Today is FOMC with a presser, which is anticipated to create some potentially wide swings in price. As such, we’ll mark today as a “wild-card for direction with estimated scenarios to consider for today’s trading.
Bull Scenario: Price sustains a bid above 4075, initially targets 4100 – 4110 zone.
Bear Scenario: Price sustains an offer below 4075, initially targets 4050 – 4045 zone.
PVA High Edge = 4091 PVA Low Edge = 4045 Prior POC = 4087
*****The 3 Day Cycle has a 91% probability of fulfilling Positive Cycle Statistics covering 12 years of recorded tracking history.
For more detailed information for both bullish and bearish projected targets, please visit: PTG 3 Day Cycle and/or reference the Cycle Spreadsheet below:
Link to access full Cycle Spreadsheet > > Cycle Day 2 (CD2)
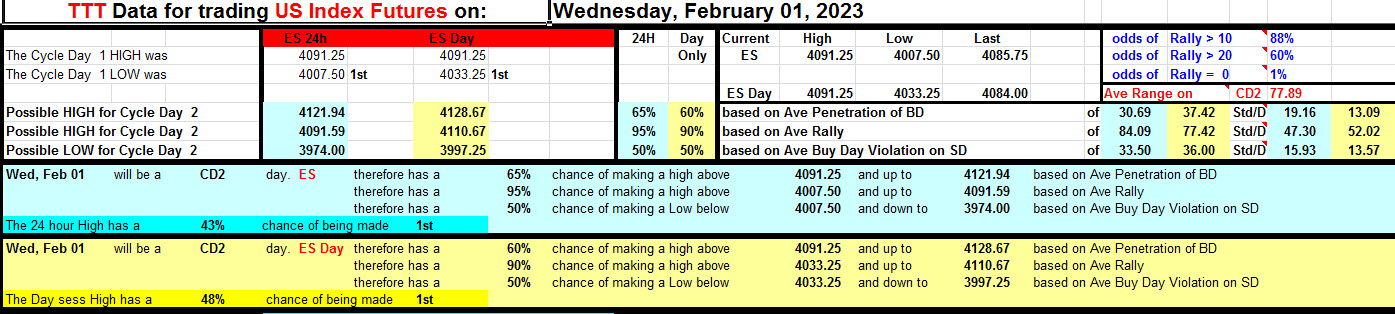
Range Projections and Key Levels (ES) March 2023 (H) Contract
HOD ATR Range Projection: 4086; LOD ATR Range Projection: 4020; 3 Day Central Pivot: 4065; 3 Day Cycle Target: 4094; 10 Day Average True Range 65; VIX: 19
Nasdaq 100 (NQ)

Today is Cycle Day 2 (CD2)…Price declined on CD1 establishing a new cycle low at 11871. Normal for CD2 is for some consolidation to work off prior rally. Today is FOMC with a presser, which is anticipated to create some potentially wide swings in price. As such, we’ll mark today as a “wild-card for direction with estimated scenarios to consider for today’s trading.
Bull Scenario: IF Bulls sustains bid above 12090, THEN initial upside estimate targets 12156– 12186 zone.
Bear Scenario: IF Bears sustains offer below 12090, THEN initial downside estimate targets 12000 – 11980 zone.
PVA High Edge = 12125 PVA Low Edge = 11995 Prior POC = 12109
Range Projections and Key Levels (NQ) March 2022 (H) Contract
HOD ATR Range Projection: 12363; LOD ATR Range Projection: 11890; 3 Day Central Pivot: 12096; 3 Day Cycle Target: 12185; 10 Day Average True Range: 278; VIX: 19

Trade Strategy: Our tactical trade strategy will simply remain unaltered…We’ll be flexible to trade both long and short side from Decision Pivot Levels. Continue to focus on Bull/Bear Stackers and Premium/Discounts. As always, remaining in alignment with dominant intra-day force increases probabilities of producing winning trades.
Stay Focused…Non-Biased…Disciplined ALWAYS USE STOPS!
Good Trading…David
“Knowing is not enough, We must APPLY. Willing is not enough, We must DO.” –Bruce Lee
*****This trade strategy report is disseminated for “education only” and should not be viewed in any way as a recommendation to buy or sell futures products.”
PAST PERFORMANCE IS NOT NECESSARILY INDICATIVE OF FUTURE RESULTS
IMPORTANT NOTICE! No representation is being made that the use of this strategy or any system or trading methodology will generate profits. Past performance is not necessarily indicative of future results. There is substantial risk of loss associated with trading securities and options on equities. Only risk capital should be used to trade. Trading securities is not suitable for everyone.
Disclaimer: Futures, Options, and Currency trading all have large potential rewards, but they also have large potential risk. You must be aware of the risks and be willing to accept them in order to invest in these markets. Don’t trade with money you can’t afford to lose.
This website is neither a solicitation nor an offer to Buy/Sell futures, options, or currencies. No representation is being made that any account will or is likely to achieve profits or losses similar to those discussed on this web site. The past performance of any trading system or methodology is not necessarily indicative of future results.
CFTC RULE 4.41 –HYPOTHETICAL OR SIMULATED PERFORMANCE RESULTS HAVE CERTAIN LIMITATIONS. UNLIKE AN ACTUAL PERFORMANCE RECORD, SIMULATED RESULTS DO NOT REPRESENT ACTUAL TRADING. ALSO, SINCE THE TRADES HAVE NOT BEEN EXECUTED, THE RESULTS MAY HAVE UNDER-OR-OVER COMPENSATED FOR THE IMPACT, IF ANY, OF CERTAIN MARKET FACTORS, SUCH AS LACK OF LIQUIDITY. SIMULATED TRADING PROGRAMS IN GENERAL ARE ALSO SUBJECT TO THE FACT THAT THEY ARE DESIGNED WITH THE BENEFIT OF HINDSIGHT. NO REPRESENTATION IS BEING MADE THAT ANY ACCOUNT WILL OR IS LIKELY TO ACHIEVE PROFIT OR LOSSES SIMILAR TO THOSE SHOWN