
Markets
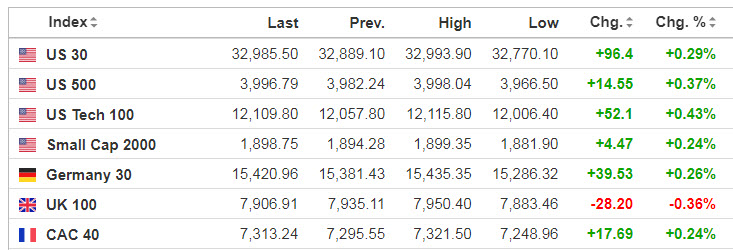
Source: SeekingAlpha.com
Economic Calendar
8:30 International Trade in Goods (Advance)
8:30 Retail Inventories (Advance)
8:30 Wholesale Inventories (Advance)
9:00 S&P CoreLogic Case-Shiller Home Price Index
9:00 FHFA House Price Index
9:45 Chicago PMI
10:00 Consumer Confidence
10:00 Richmond Fed Mfg.
1:00 PM Money Supply
2:30 PM Fed’s Goolsbee Speech
3:00 PM Farm Prices
https://www.investing.com/economic-calendar/
S&P 500

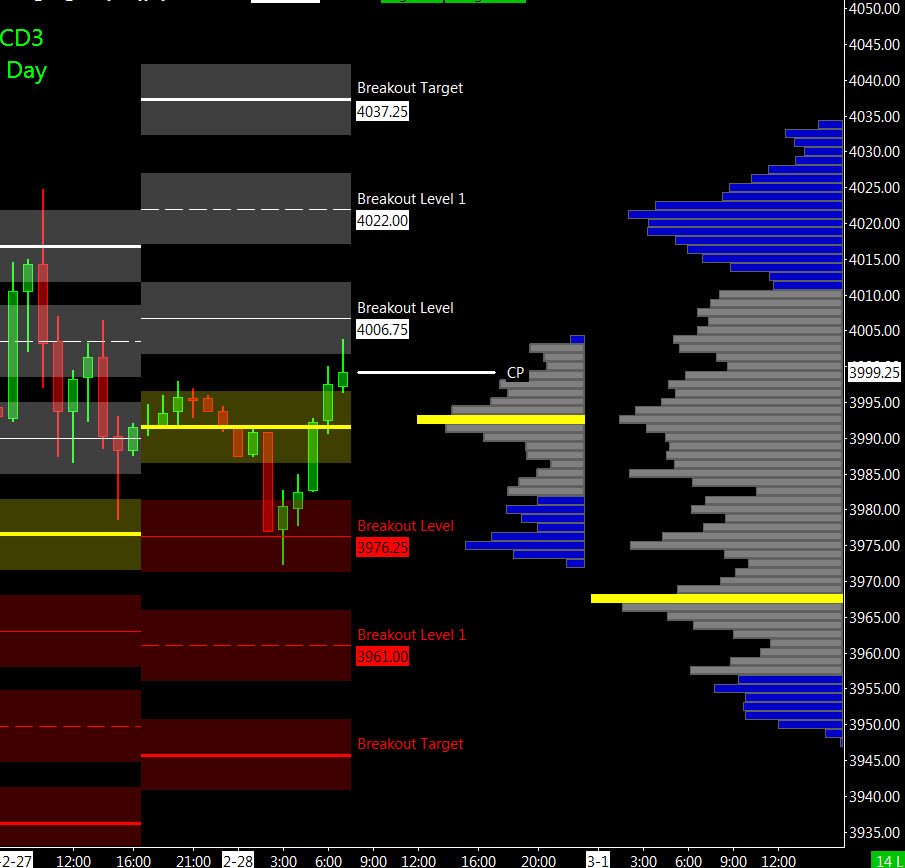
Prior Session was Cycle Day 2 (CD2): Normal CD2 as price oscillated above our stated Line-in-the Sand (3975) upwards to 4025, fulfilling 3 Day Cycle Target (4023). Prior range was 51 handles on 1.583M contracts exchanged.
…Transition from Cycle Day 2 to Cycle Day 3
This leads us into Cycle Day 3 (CD3): Three-Day Cycle Target (4023) was fulfilled during prior session. Price is currently mid-range oscillating around 3-Day Central Pivot (3995). We will mark this level as today’s Line-in-the-Sand (LIS) as well as mark today as a “wild-card” for direction. As long as price opens above CD1 Low (3947.50) the cycle will be complete. As such, estimated scenarios to consider for today’s trading.
Bull Scenario: Price sustains a bid above 3995, initially targets 4005 – 4010 zone.
Bear Scenario: Price sustains an offer below 3995, initially targets 3975 – 3970 zone.
PVA High Edge = 4010 PVA Low Edge = 3988 Prior POC = 4004
Range Projections and Key Levels (ES) March 2023 (H) Contract
HOD ATR Range Projection: 4035; LOD ATR Range Projection: 3940; 3 Day Central Pivot: 3995; 3 Day Cycle Target: 4023; 10 Day Average True Range 63; VIX: 20
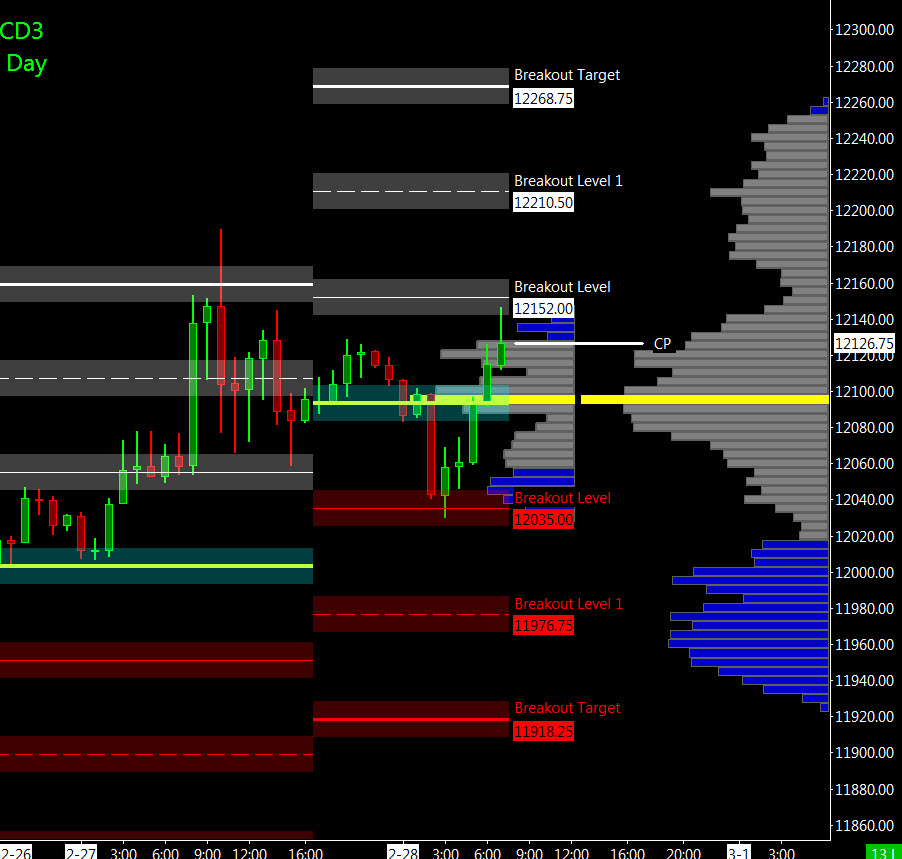
Nasdaq 100 (NQ)

Today is Cycle Day 3 (CD3)…Three-Day Cycle Statistic will be fulfilled as long as price trades above CD1 Low (11923) during RTH session. Price is currently mid-range oscillating around 3-Day Central Pivot (12100). We will mark this level as today’s Line-in-the-Sand (LIS) as well as mark today as a “wild-card” for direction. As such, estimated scenarios to consider for today’s trading.
Bull Scenario: IF Bulls sustains bid above 12100, THEN initial upside estimate targets 12150– 12170 zone.
Bear Scenario: IF Bears sustains offer below 12100, THEN initial downside estimate targets 12045 – 12025 zone.
PVA High Edge = 12133 PVA Low Edge = 12073 Prior POC = 12092
Range Projections and Key Levels (NQ) March 2022 (H) Contract
HOD ATR Range Projection: 12287; LOD ATR Range Projection: 11888; 3 Day Central Pivot: 12100; 3 Day Cycle Target: 12155; 10 Day Average True Range: 257; VIX: 20
Trade Strategy: Our tactical trade strategy will simply remain unaltered…We’ll be flexible to trade both long and short side from Decision Pivot Levels. Continue to focus on Bull/Bear Stackers and Premium/Discounts. As always, remaining in alignment with dominant intra-day force increases probabilities of producing winning trades.
Stay Focused…Non-Biased…Disciplined ALWAYS USE STOPS!
Good Trading…David
“Knowing is not enough, We must APPLY. Willing is not enough, We must DO.” –Bruce Lee
*****This trade strategy report is disseminated for “education only” and should not be viewed in any way as a recommendation to buy or sell futures products.”
PAST PERFORMANCE IS NOT NECESSARILY INDICATIVE OF FUTURE RESULTS
IMPORTANT NOTICE! No representation is being made that the use of this strategy or any system or trading methodology will generate profits. Past performance is not necessarily indicative of future results. There is substantial risk of loss associated with trading securities and options on equities. Only risk capital should be used to trade. Trading securities is not suitable for everyone.
Disclaimer: Futures, Options, and Currency trading all have large potential rewards, but they also have large potential risk. You must be aware of the risks and be willing to accept them in order to invest in these markets. Don’t trade with money you can’t afford to lose.
This website is neither a solicitation nor an offer to Buy/Sell futures, options, or currencies. No representation is being made that any account will or is likely to achieve profits or losses similar to those discussed on this web site. The past performance of any trading system or methodology is not necessarily indicative of future results.
CFTC RULE 4.41 –HYPOTHETICAL OR SIMULATED PERFORMANCE RESULTS HAVE CERTAIN LIMITATIONS. UNLIKE AN ACTUAL PERFORMANCE RECORD, SIMULATED RESULTS DO NOT REPRESENT ACTUAL TRADING. ALSO, SINCE THE TRADES HAVE NOT BEEN EXECUTED, THE RESULTS MAY HAVE UNDER-OR-OVER COMPENSATED FOR THE IMPACT, IF ANY, OF CERTAIN MARKET FACTORS, SUCH AS LACK OF LIQUIDITY. SIMULATED TRADING PROGRAMS IN GENERAL ARE ALSO SUBJECT TO THE FACT THAT THEY ARE DESIGNED WITH THE BENEFIT OF HINDSIGHT. NO REPRESENTATION IS BEING MADE THAT ANY ACCOUNT WILL OR IS LIKELY TO ACHIEVE PROFIT OR LOSSES SIMILAR TO THOSE SHOWN