
Markets
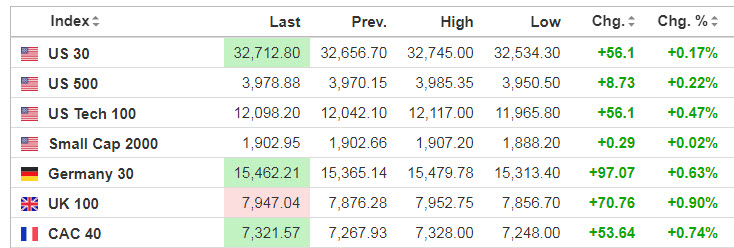
Source: SeekingAlpha.com
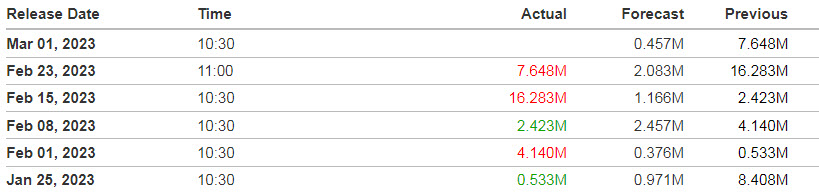
Economic Calendar
9:45 PMI Manufacturing Index
10:00 ISM Manufacturing Index
10:00 Construction Spending
https://www.investing.com/economic-calendar/
 10:30 EIA Petroleum Inventories
S&P 500

***Written Tuesday evening for Wednesday’s trading for contribution to MrTopStep’s “The Opening Print” publication.
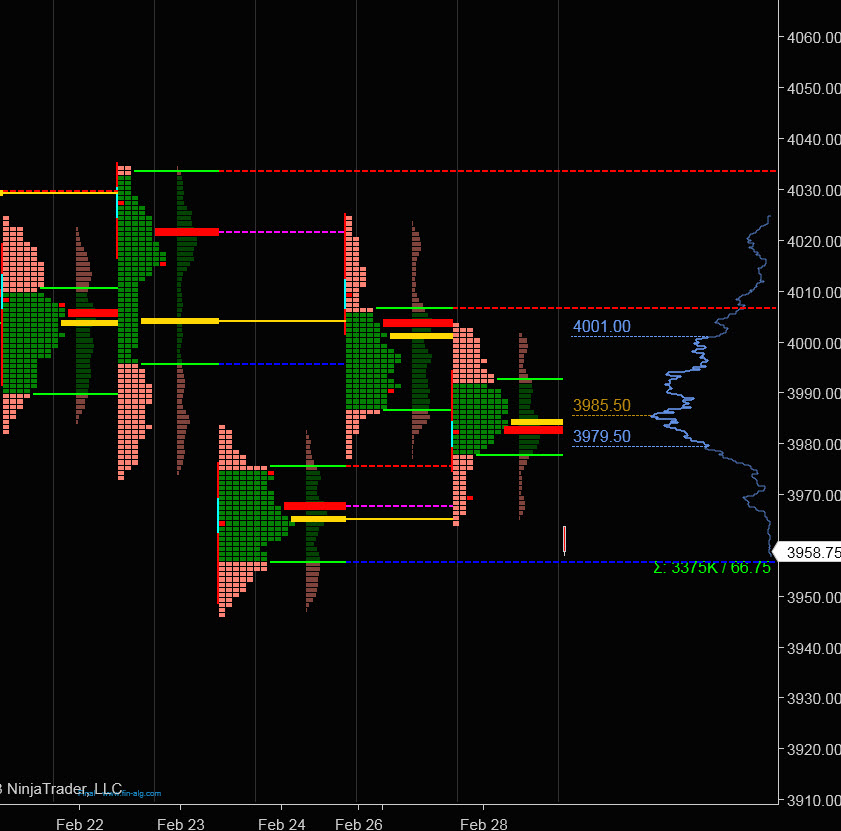
Prior Session was Cycle Day 3 (CD3): Three-Day Cycle Objective (4023) was fulfilled as price oscillated between our range parameters (3975 – 4005) outlined in previous DTS 02/28/23. End of Month (EOM) sell program pushed price to close near lows of the day. Prior range was 38 handles on 1.770M contracts exchanged.
…Transition from Cycle Day 3 to Cycle Day 1
This leads us into Cycle Day 1 (CD1): Month of March starts off as a CD1 with Average Decline measuring 3942. We’ll be anticipating an early “spill-down” that has high potential to be absorbed and push back into the 5-day range. As such, scenarios to consider for today’s trading.
Bull Scenario: Price sustains a bid above 3965, initially targets 3980 – 3985 zone.
Bear Scenario: Price sustains an offer below 3965, initially targets 3955 – 3950 zone.
PVA High Edge = 3993 PVA Low Edge = 3977 Prior POC = 3984
*****The 3 Day Cycle has a 91% probability of fulfilling Positive Cycle Statistics covering 12 years of recorded tracking history.
For more detailed information for both bullish and bearish projected targets, please visit: PTG 3 Day Cycle and/or reference the Cycle Spreadsheet below:
Link to access full Cycle Spreadsheet > > Cycle Day 1 (CD1)
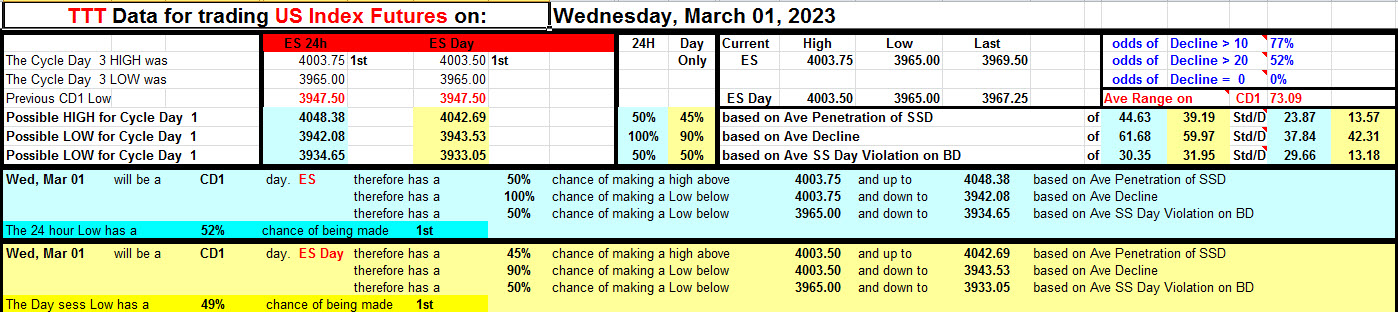
Range Projections and Key Levels (ES) March 2023 (H) Contract
HOD ATR Range Projection: 4016; LOD ATR Range Projection: 3931; 3 Day Central Pivot: 3986; 3 Day Cycle Target: 4026; 10 Day Average True Range 62; VIX: 20
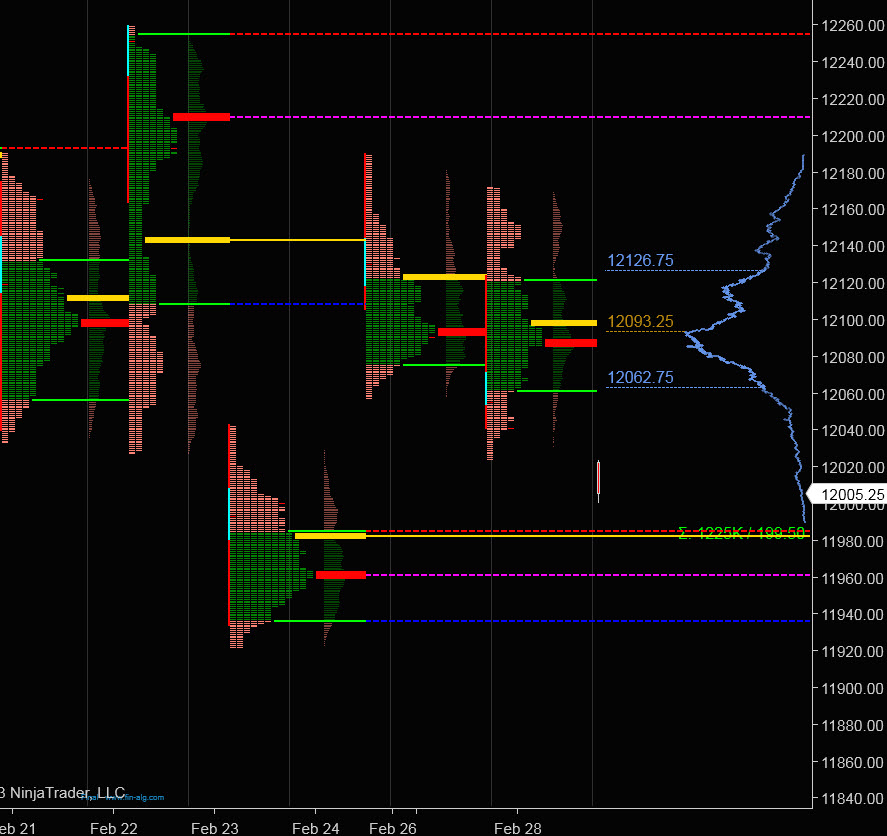
Nasdaq 100 (NQ)

Today is Cycle Day 1 (CD1)…Month of March starts of as a CD1 with Average Decline measuring 11927. We’ll be anticipating an early “spill-down” that has high potential to be absorbed and push back into the 5-day range. As such, scenarios to consider for today’s trading.
Bull Scenario: IF Bulls sustains bid above 12025, THEN initial upside estimate targets 12120– 12140 zone.
Bear Scenario: IF Bears sustains offer below 12025, THEN initial downside estimate targets 11990 – 11980 zone.
PVA High Edge = 12120 PVA Low Edge = 12060 Prior POC = 12088
Range Projections and Key Levels (NQ) March 2022 (H) Contract
HOD ATR Range Projection: 12231; LOD ATR Range Projection: 11900; 3 Day Central Pivot: 12072; 3 Day Cycle Target: 12344; 10 Day Average True Range: 269; VIX: 20
Trade Strategy: Our tactical trade strategy will simply remain unaltered…We’ll be flexible to trade both long and short side from Decision Pivot Levels. Continue to focus on Bull/Bear Stackers and Premium/Discounts. As always, remaining in alignment with dominant intra-day force increases probabilities of producing winning trades.
Stay Focused…Non-Biased…Disciplined ALWAYS USE STOPS!
Good Trading…David
“Knowing is not enough, We must APPLY. Willing is not enough, We must DO.” –Bruce Lee
*****This trade strategy report is disseminated for “education only” and should not be viewed in any way as a recommendation to buy or sell futures products.”
PAST PERFORMANCE IS NOT NECESSARILY INDICATIVE OF FUTURE RESULTS
IMPORTANT NOTICE! No representation is being made that the use of this strategy or any system or trading methodology will generate profits. Past performance is not necessarily indicative of future results. There is substantial risk of loss associated with trading securities and options on equities. Only risk capital should be used to trade. Trading securities is not suitable for everyone.
Disclaimer: Futures, Options, and Currency trading all have large potential rewards, but they also have large potential risk. You must be aware of the risks and be willing to accept them in order to invest in these markets. Don’t trade with money you can’t afford to lose.
This website is neither a solicitation nor an offer to Buy/Sell futures, options, or currencies. No representation is being made that any account will or is likely to achieve profits or losses similar to those discussed on this web site. The past performance of any trading system or methodology is not necessarily indicative of future results.
CFTC RULE 4.41 –HYPOTHETICAL OR SIMULATED PERFORMANCE RESULTS HAVE CERTAIN LIMITATIONS. UNLIKE AN ACTUAL PERFORMANCE RECORD, SIMULATED RESULTS DO NOT REPRESENT ACTUAL TRADING. ALSO, SINCE THE TRADES HAVE NOT BEEN EXECUTED, THE RESULTS MAY HAVE UNDER-OR-OVER COMPENSATED FOR THE IMPACT, IF ANY, OF CERTAIN MARKET FACTORS, SUCH AS LACK OF LIQUIDITY. SIMULATED TRADING PROGRAMS IN GENERAL ARE ALSO SUBJECT TO THE FACT THAT THEY ARE DESIGNED WITH THE BENEFIT OF HINDSIGHT. NO REPRESENTATION IS BEING MADE THAT ANY ACCOUNT WILL OR IS LIKELY TO ACHIEVE PROFIT OR LOSSES SIMILAR TO THOSE SHOWN